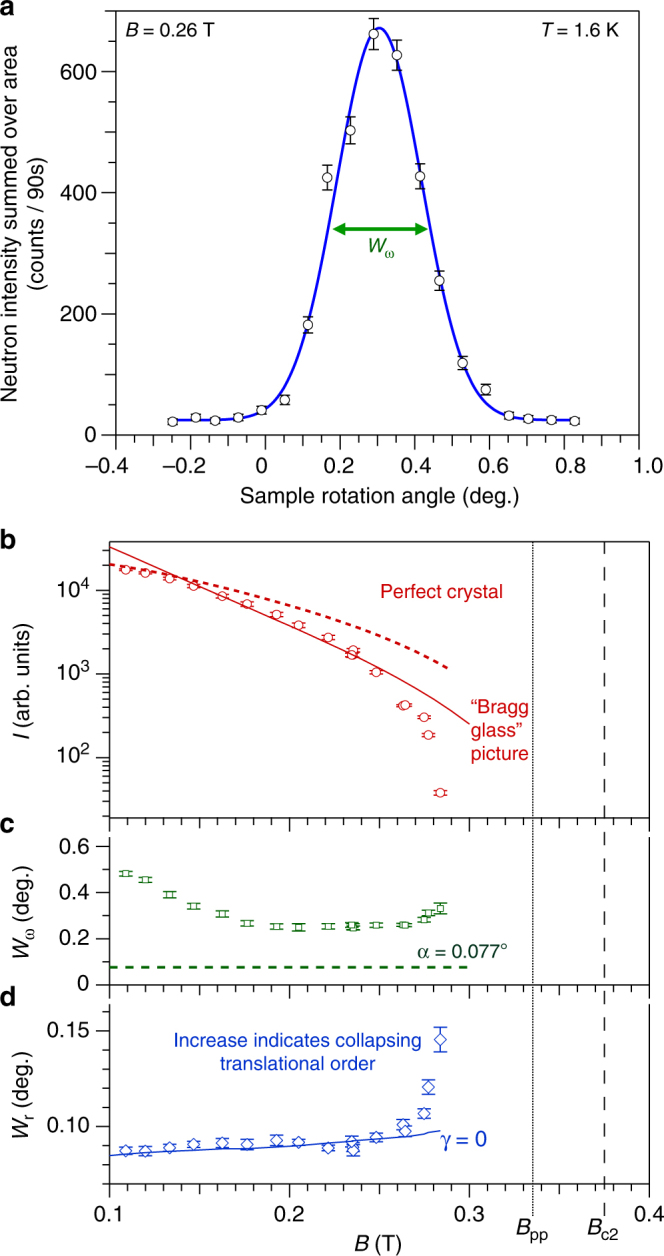
Fig. 4.

Neutron scattering in parallel field geometry at 1.6 K. a Rocking curves are collected by rotating the sample, field and vortices together through the Bragg condition. Neutron counts are summed over an area on the 2D multidetector encompassing the Bragg spot (red sector in Fig. 2a). Error bars are determined by Poisson statistics. Solid line is a Gaussian fit, with Wω denoting the measured rocking curve width. b Field dependence, at T = 1.6 K, of the scattered neutron intensity I integrated over the rocking curve. Vortex ensembles are prepared by field-cooling, i.e. by cooling in the desired field from the normal state. Dotted line is a guide to the eye illustrating the form expected if vortices were arranged in a perfect 2D lattice. A steeper descent arises from the quasi-long-range order of the Bragg glass picture and scales to the data well (solid line) up to 0.26 T, whereupon I decays rapidly. Note that I vanishes much before the peak effect Bpp. c Wω probes correlations along the vortices in the parallel field geometry (Fig. 2a). The dominant contribution to the instrument resolution is the angular spread a of the incoming beam, illustrated by the dashed line. a = 0.077° corresponds to a maximum resolvable correlation length s = 2.35/(ga) = 240a0. d Radial width Wr of the Bragg spot on the 2D neutron multidetector at the peak of the rocking curve (Fig. 2a) is sensitive to correlations along the vortices and to translational correlations in the vortex plane. Solid line depicts the calculated radial width under the assumption of infinite translational correlational length 1/γ, i.e. it represents the contribution to Wr from instrument resolution and from finite correlations along the vortices. The rapid departure from this line at 0.27 T indicates collapsing translational order as the order-disorder transition is approached
