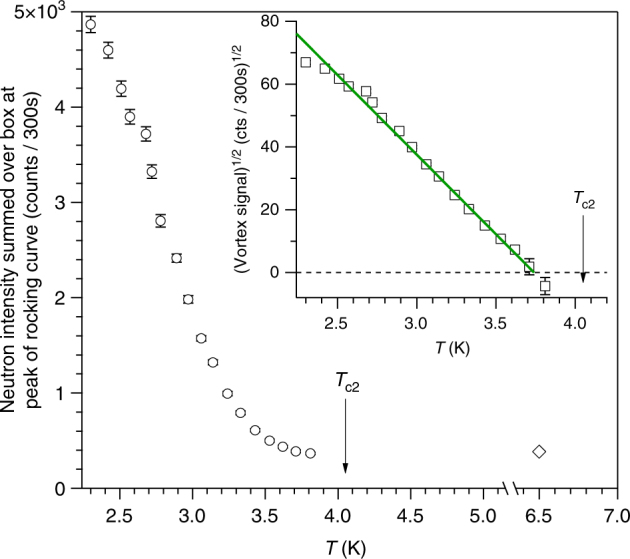
Fig. 6.

Temperature dependence at 0.13 T. Neutron scattering from the vortex ensemble is measured on warming, after field-cooling to 2 K. Using the perpendicular field geometry (Fig. 2b), neutron counts are collected at the peak of the rocking curve and summed over a box on the 2D multidetector encompassing the Bragg spot (red box in Fig. 2b). The diamond indicates a background measurement at T > Tc characterising the non-vortex scattering that arises predominantly from the walls of the closed-cycle refrigerator used to cool the sample. Error bars are determined by Poisson statistics. Inset shows the square root of the vortex signal Ip, which is proportional to the vortex form factor h when the field is constant. Negative values of vortex signal, arising from the background subtraction, are indicated by plotting . Green line is a guide to the eye showing a linear variation, as expected from mean field theory in the vicinity of a phase transition
