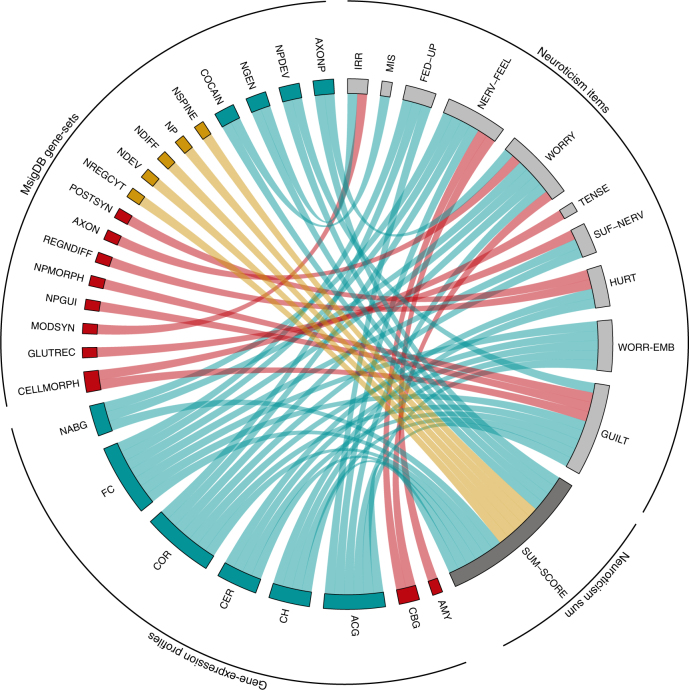
Fig. 2.
Circle plot of statistically associated gene-sets of the 7,297 gene-sets tested (MsigDB gene-sets and gene-expression profiles). This circle plot presents all gene-sets that were significantly associated (Bonferroni corrected P-value threshold: 0.05/7,297 = 6.85 × 10⁻⁶) to at least one of the individual neuroticism items or to the sum-score. Each tract connects a gene-set to the phenotype with which it is associated. Tracts colored in red indicate gene-sets that were associated to individual items, but not to the sum-score. In contrast, tracts colored in yellow indicate gene-sets that were associated to the neuroticism sum-score, but not to any of the individual items. Blue tracts refer to gene-sets that were found to be associated to the sum-score and at least one of the individual items. See Supplementary Data 47 for a description of the gene-sets included in this figure. See Supplementary Table 1 for a description of the item labels

