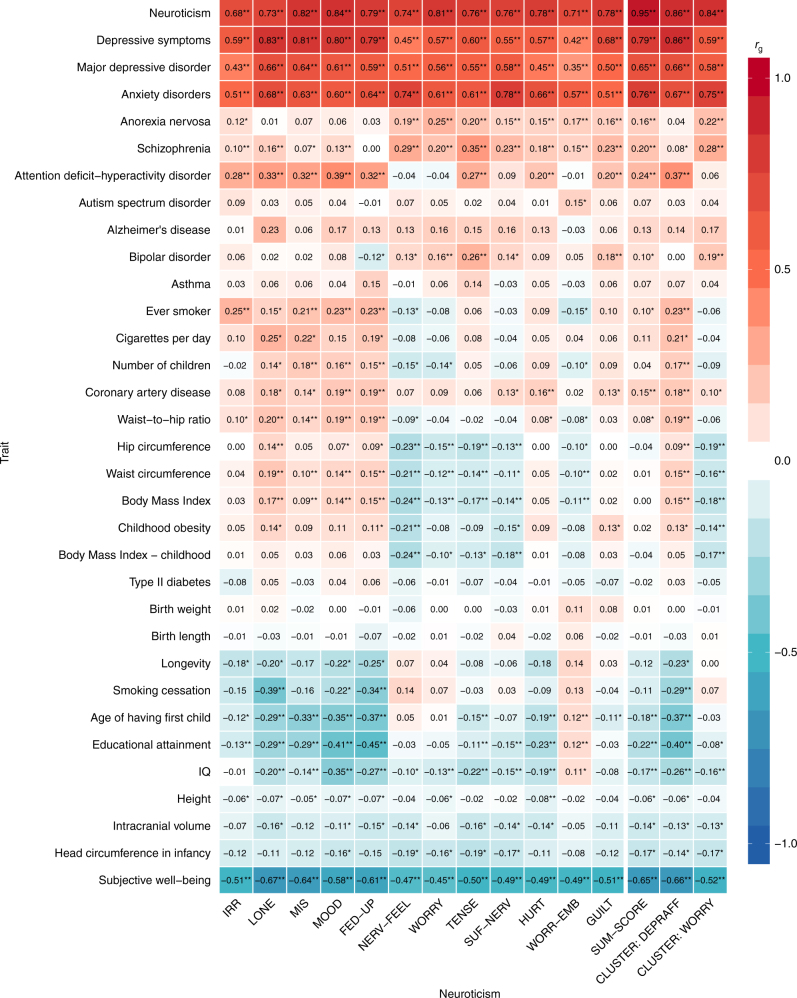
Fig. 3.
Genetic correlations of 12 neuroticism items, the sum-score and the two item clusters with 33 external traits. Genetic correlations of neuroticism items (see Supplementary Table 1 for a description of the item labels), sum-score, and the item clusters depressed affect (CLUSTER: DEPRAFF) and worry (CLUSTER: WORRY; x axis) with 33 other traits (y axis; Supplementary Data 49) computed with cross-trait LD score regression. P values and 95% confidence intervals for the rg’s are provided in Supplementary Data 50. Exact values of the genetic correlations are shown in the cells. *P < 0.01; **Bonferroni corrected P-value threshold: P < 1.01 × 10⁻⁴ (0.05/(15 × 33))

