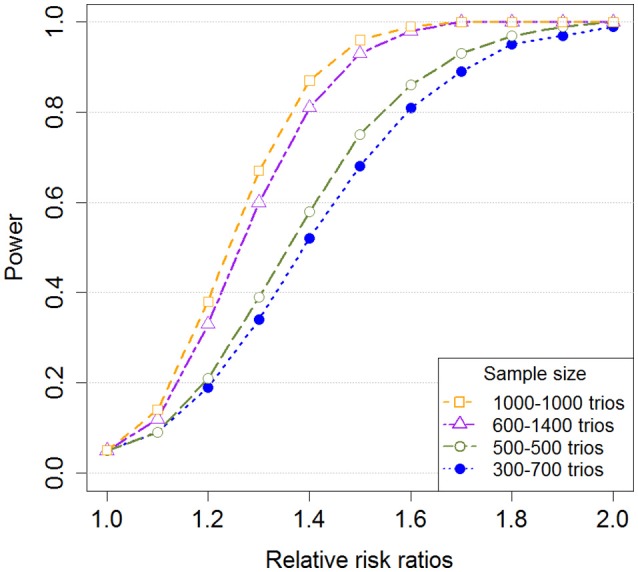
Figure 10.

Single-SNP power for different sample sizes and proportions of exposed to unexposed mothers. The figure shows the power for detecting a GxE effect with increasing relative risk ratios (RRR). The relative risk in the smallest exposure group was increased, but the relative risk in the largest exposure group was set equal to 1. Additionally, we used a minor allele frequency (MAF) of 0.2, a nominal significance level of 5%, and a total sample size of 1,000 triads and 2,000 triads with different proportions of exposed/unexposed mothers. Note that the minor allele was used as the risk allele.
