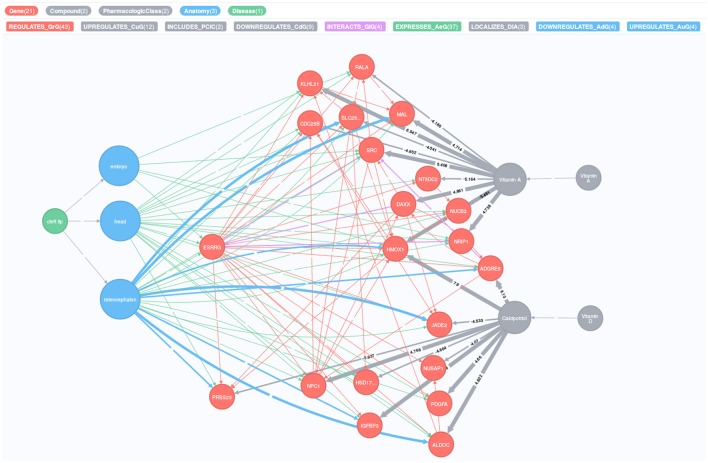
Figure 9.
Relationships between cleft lip, vitamins and ESRRG, visualized as a heterogenic network, where each relationship evidenced in public databases is depicted as an arrow connecting two nodes. Different types of nodes (e.g., genes, diseases, etc.) are connected by different types of relationships (e.g., regulation, interaction, etc.). The nodes and arrows are colored according to the legend at the top of the figure. The thickness of the “DOWNREGULATES_AdG” arrow is less than that of “UPREGULATES_AuG,” and similarly for “DOWNREGULATES_CdG” and “UPREGULATES_CuG.” The numbers on the two latter arrows show the Z-score, which is a measure for the strength of the influence. The figure was generated using the Hetionet network (see the Materials and Methods section for details).

