Fig. 1.

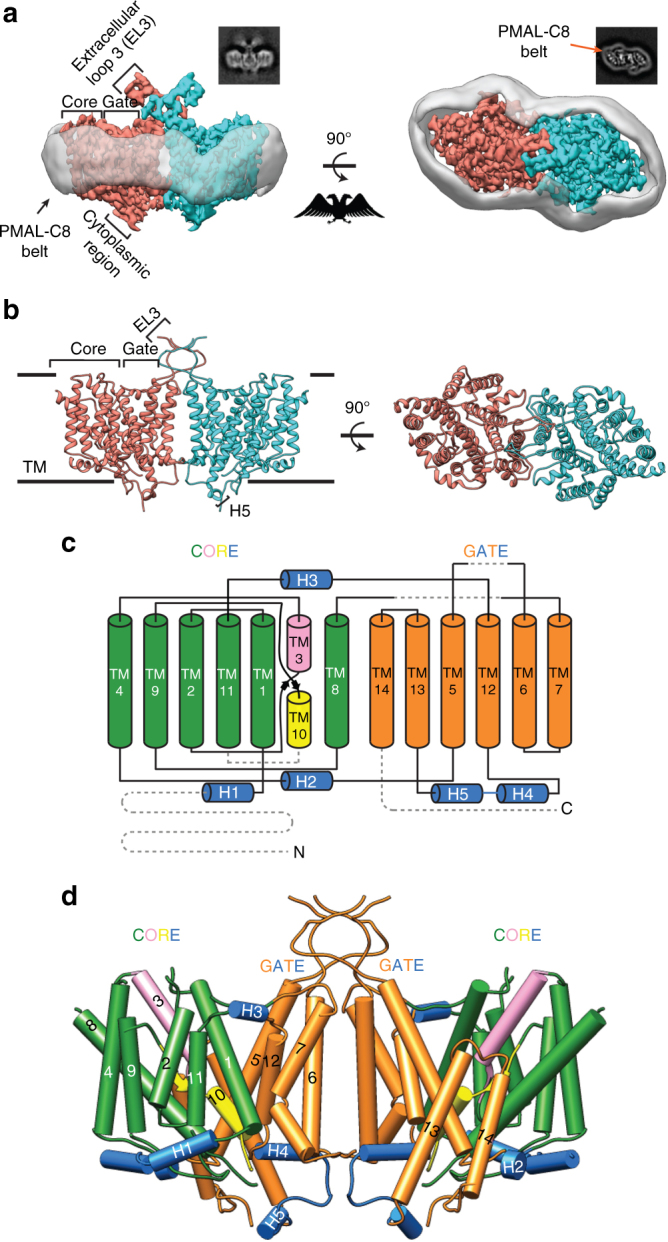
CryoEM reconstruction and model of human NBCe1. a In all, 3.9-Å cryoEM densities of the NBCe1 dimer showing side (left) and top (right) views. Individual monomers are colored differently. The transparent gray density represents the amphipol belt. The corresponding 2D class averages are shown in the insets. b Ribbon model (side and top views) of the NBCe1 dimer. c Topology of NBCe1. TMs 1, 2, 4, 8, 9, 11 (green cylinders) together with TM3 (pink) and TM10 (yellow) belong to the core domain. TMs 5, 6, 7, 12, 13, and 14 (orange cylinders) form the gate domain. Helices 1–5 (H1–5) are marked blue. Dotted gray lines represent unmodeled regions. d Three-dimensional (3D) model of the NBCe1 dimer. TMs 1–14 and helices H1-5 are shown as cylinders
