
Figure 5.
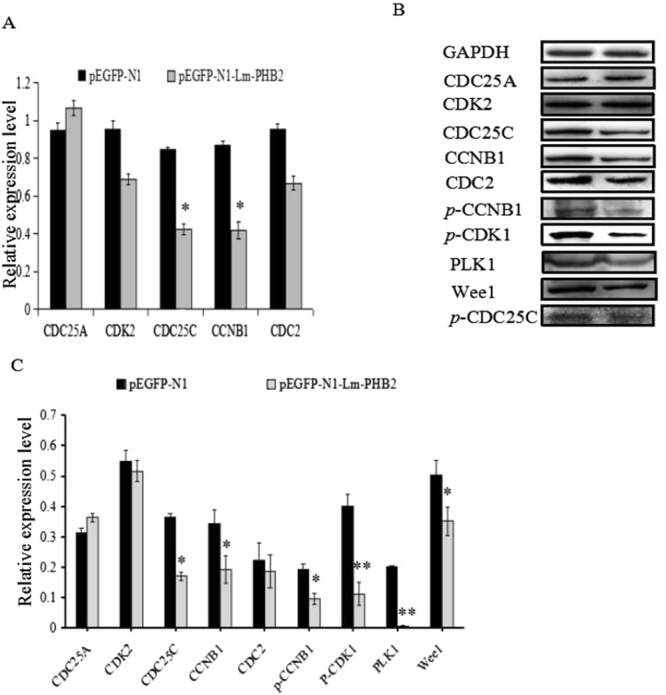
Lm-PHB2 induces cell cycle arrest through down-regulating the expression and phosphorylation level of cell cycle proteins. (A,B) Changes in relative expression levels of cell cycle proteins determined by qRT-PCR and western blot. (C) The histogram in B compares the intensities of the various bands shown in the blot. Data in the histograms are the means ± SDs from three determinations. ‘*’ and ‘**’ respectively indicates significantly different from PBS-treated cells at the P < 0.05 or P < 0.01 level.