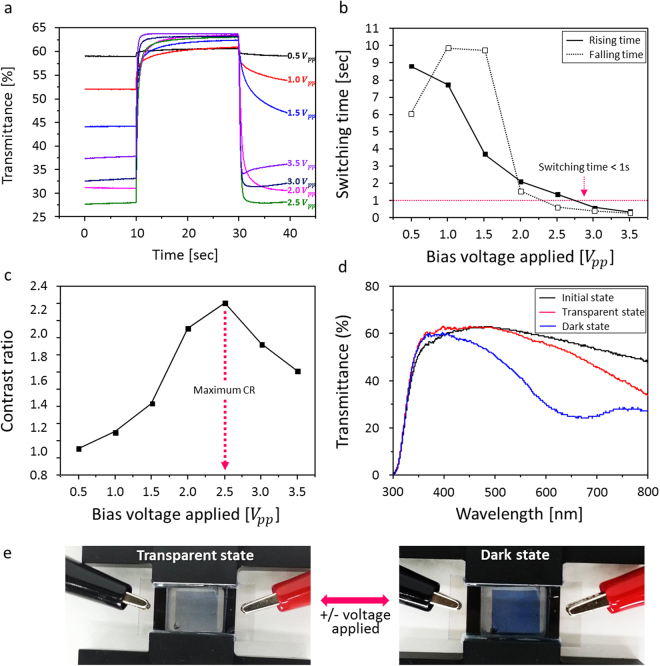
Figure 5.
Electrochromic performance of the PEDOT:PSS based ECD cell with G4L as electrode. (a) The optical luminous transmittance responses measured as a function of applied +/− voltages ranging from +0.5 to 3.5 V for Tt and −0.5 to −3.5 V for Td with an offset voltage of −0.5 V during 40 s, (b) the plotted optical switching time, generally defined as the time to reach 90% of the optical changes in between Tt and Td, (c) the optical contrast ratio calculated from the luminous transmittance difference, also in between Tt and Td, (d) the transmittance spectra measured at wavelengths ranging from 300 nm to 800 nm at an applied potential of ±2.5 V for transparent (positive, red line) and for dark (negative, blue line) states and (e) the photo images of the optical changes under the applied bias voltages.

