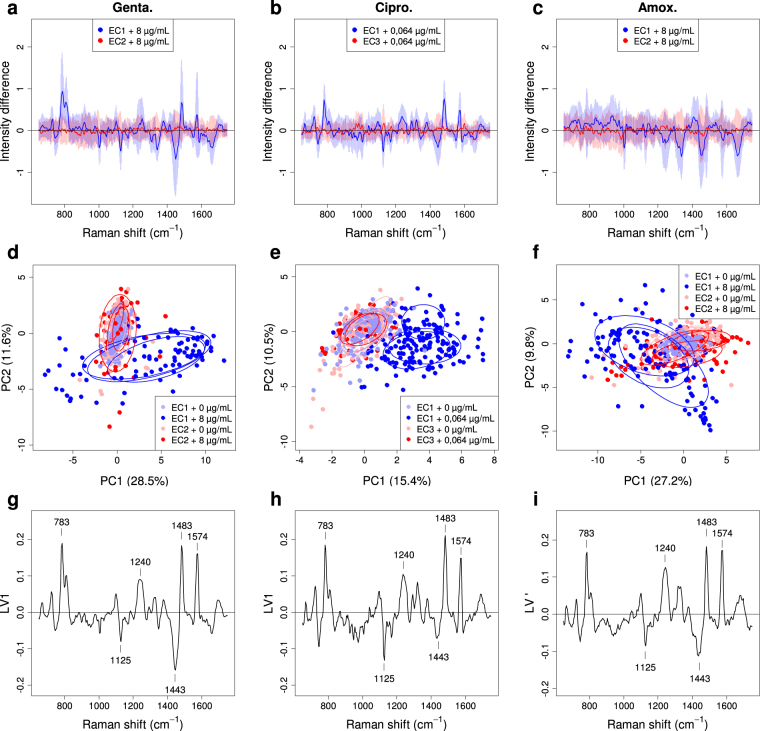
Figure 2.
Spectral signature of the antibiotic effect extracted from the difference spectra of single bacterial cells. The “difference spectra” (i.e. the differences between each normalized net spectrum and the mean of all the normalized net spectra measured on the non-exposed bacterial cells) of single bacterial cells incubated for 2 hours are shown for (a) gentamicin (0 and 8 µg/mL, 374 spectra), (b) ciprofloxacin (0 and 0.064 µg/mL, 483 spectra) and (c) amoxicillin (0 and 8 µg/mL, 474 spectra). For clarity, only the mean of the difference spectra is shown, for the exposed susceptible bacteria (blue line) and the exposed resistant ones (red line), as well as the corresponding ±σ standard-deviation range (light blue and pink bands). (d–f) Corresponding PCA plots of difference spectra, for susceptible bacteria exposed (dark-blue dots) and non-exposed (light-blue dots) as well as for resistant bacteria exposed and non-exposed (resp. red and pink dots). 50%-confidence ellipses are also plotted with the same colors, independently for each of the three experiments dates, as a visual guide to show the reproducibility of experiments. (g–i) Plots of the loading vectors, LV1 for (g) gentamicin and (h) ciprofloxacin, giving the weights involved in the PC1 score, and LV’ = (LV1–LV2) × √2/2 for (i) amoxicillin, giving the weights involved in the (PC1–PC2) × √2/2 score. These loading vectors constitute the “spectral signature” of the antibiotic effect.

