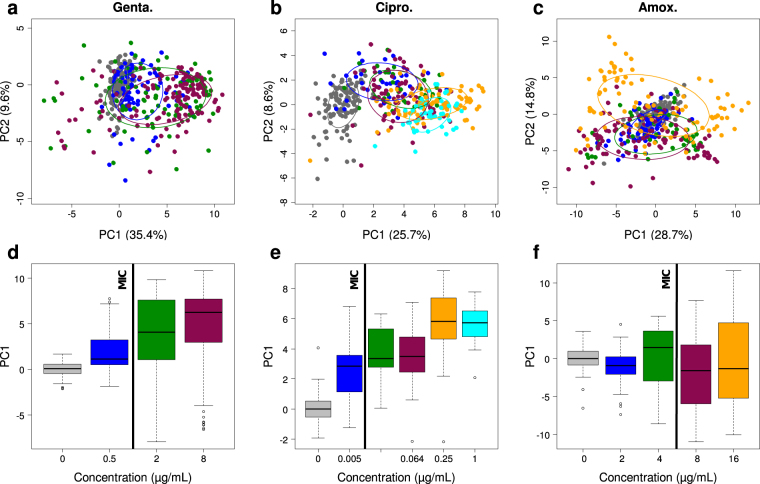
Figure 3.
Analysis of the dose-effect relationship for the three antibiotics. (a–c) PCA plots of the difference spectra (previously defined in text and in Fig. 2) for single bacterial cells of susceptible strain (EC1) incubated for 2 hours with (a) gentamicin (382 spectra), (b) ciprofloxacin (345 spectra) and (c) amoxicillin (418 spectra) at different concentrations (two to four independent experiments per concentration and antibiotic in most cases), with 50%-confidence ellipses plotted for each concentration. (d–f) Box plots of the distributions of the PC1 scores for the different antibiotic concentrations (indicating the correspondence between colors and concentrations). Vertical black lines show the reference MICs.

