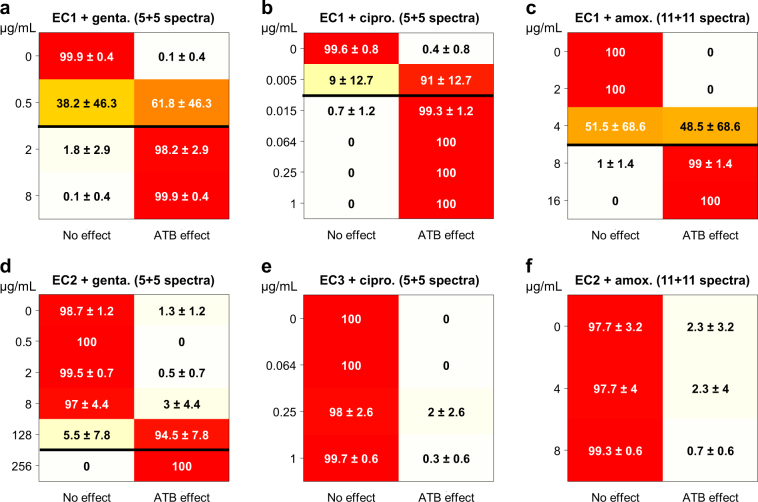
Figure 5.
Confusion matrices for automatic discrimination between classes “No effect” and “ATB effect” at different antibiotic concentrations by a SVM classifier. The matrices are plotted for susceptible strain EC1 and (a) gentamicin (847 spectra), (b) ciprofloxacin (850 spectra) and (c) amoxicillin (602 spectra), and for resistant strains (d) EC2 and gentamicin (404 spectra), (e) EC3 and ciprofloxacin (399 spectra), and (f) EC2 and amoxicillin (366 spectra). For each antibiotic concentration (one row of the matrix), the figures report the classification rate in each of the “No effect” and “ATB effect” classes (in %, with its standard deviation calculated among the 2 to 7 independent experiments at the considered concentration). Horizontal black lines show reference MIC values for the susceptible strain (a–c), as well as the observed complete transition observed for resistant strain EC2 and gentamicin (d) when extending the concentration range to very high values.

