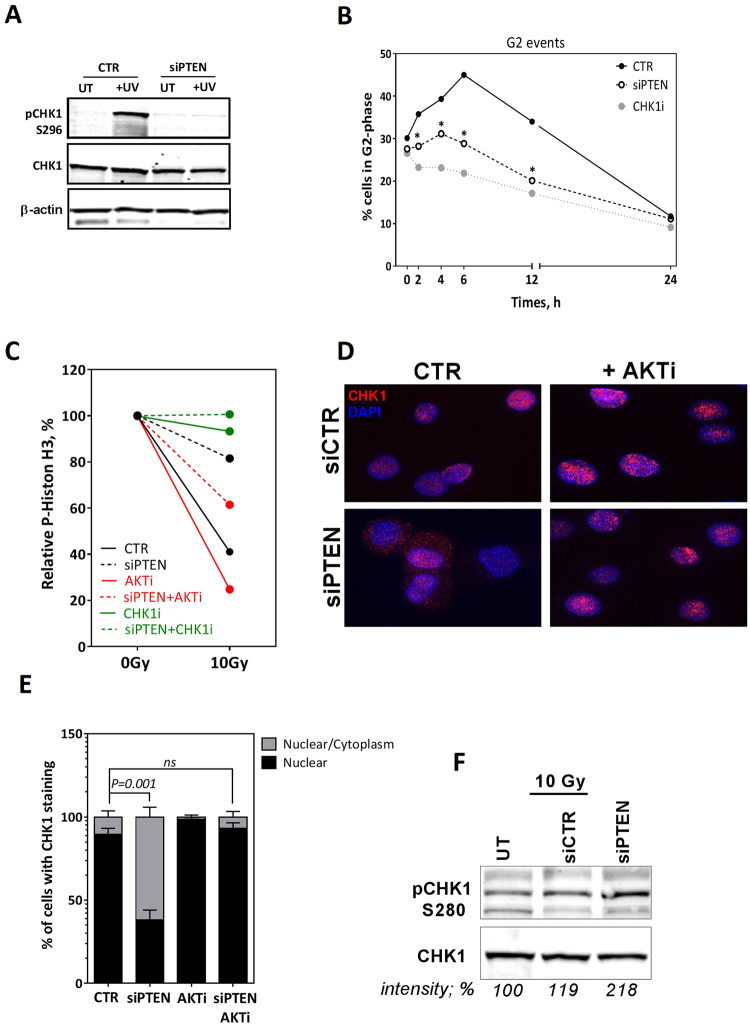
Figure 4.
PTEN contributes to the G2/M checkpoint. (A) DU145 cells were transfected with either scrambled (CTR) or PTEN (siPTEN) siRNA. After 48 h, cells were UV-irradiated (50 J/m2) and the CHK1 auto-phosphorylation site (S296) was immunoblotted. Both ß-actin and CHK1 were used as loading controls. (B) Percent of DU145 cells in G2-phase was monitored using propidium iodide (PI) staining by flow cytometry after treatment with scRNA, siPTEN or the CHK1 inhibitor UCN01 (50 nM). Asterisk (*) represents significant difference (P < 0.05). (C) After the indicated treatments, DU145 cells were irradiated with 10 Gy, treated with colcemid to accumulate mitotic cells and then co-stained with phosphohistone H3 (S10) antibody and PI to detect mitotic cells. Shown are the means ± SEM from three experiments. (D) Immunofluorescence microscopy of CHK1 2 h after 2 Gy in siRNA-treated DU145 cells. (E) Quantitation of subcellular localization of CHK1 presented in D. Shown are the means ± SEM from at least three different experiments. ns: not statistically significant. (F) Western blot showing pCHK1-S280 and CHK1 in DU145 transfected with siCTR or siPTEN. Band intensities (measured by UNSCAN-IT gel V6.1) in percentage are shown.

