
Figure 5.
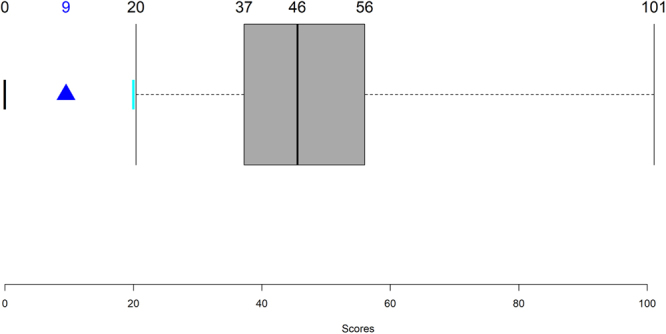
Sum of squared errors for parameter sets detected through Monte-Carlo exploration of the parameter space. All parameter sets shown comply with the following conditions: 1. phosphoinositide steady-state levels are within the intervals retrieved from the literature; 2. the relative amounts between the phosphoinositide pools match the data; 3. influxes are less than 25% of the corresponding phosphoinositide pools; 4. effluxes are less than 7% of the corresponding phosphoinositide pools. The black bar at zero represents the score of a perfect model, the best set found by the genetic algorithm is shown as a blue triangle and the manually found set is the cyan bar. The boxplot concerns the 116 admissible alternative parameter sets. Figure created in R42.