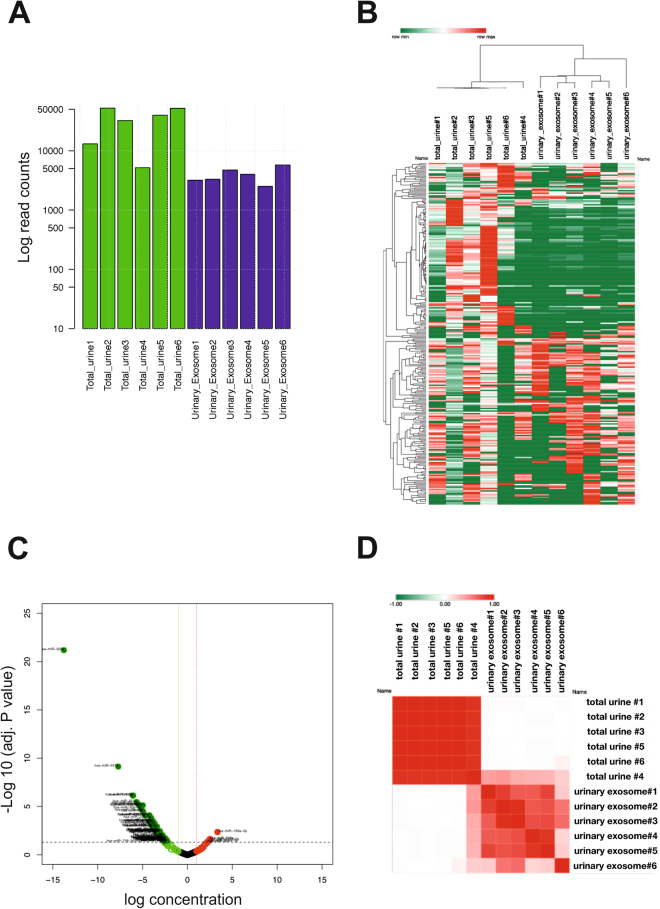
Figure 6.
miRNA profiling in the total urine and uEVs. RNA samples were derived directly from 50 ml of total urine or from uEVs, isolated by UC-SEC from 50 ml of the same urine sample, and miRNAs were profiled using NanoString. (A) Bar chart representing the read count differences between different samples. Read counts are shown in logarithmic scale. The data are sum of all detected miRNA (normalised read counts of 6 paired experiments). (B) Hierarchical clustering and heatmap of 256 miRNAs expressed in the total urine and urinary exosomes isolated from the same sample. Each row represents one miRNA and each column represents one sample. Expression levels are colour-coded (bar above, green for low and red for high levels). (C) Volcano graph showing the log10 fold difference of miRNA content in urinary exosomes compared to total urine. The black dashed line represents the p-value of 0.05. Green dash line shows −1.5 fold lower and red dash line shows 1.5 fold higher content of miRNAs in exosomes compared to total urine. (D) Similarity matrix for total urine and urinary exosome samples. The redder a field is, the more similar the samples are in terms of miRNA expression.

