Fig. 7.
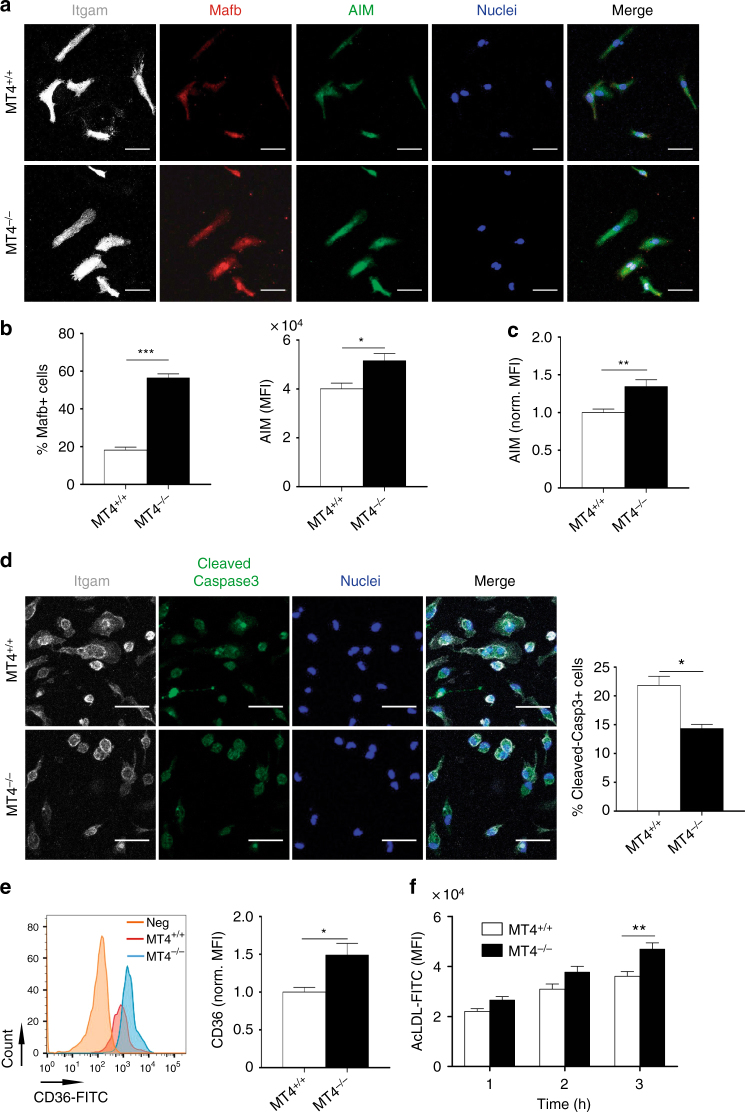
MT4-MMP-null Mafb+/AIM+ peritoneal macrophages exhibit above-normal CD36 at the cell surface and enhanced acLDL binding. a Representative images of MT4-MMP+/+ (MT4+/+) or MT4-MMP–/– (MT4−/−) mouse peritoneal macrophages elicited by 72 h TG stimulation and labeled for Itgam (white), Mafb (red), and AIM (green), and with Hoechst (blue, nuclei); scale bar, 20 µm. b Graphs show the percentage of cells Mafb+ in the nuclei (left) and the MFI of AIM within Mafb+ cells (right); n = 6 in two independent experiments. c Quantification of normalized MFI of AIM analyzed by flow cytometry in MT4+/+ or MT4−/− mouse peritoneal macrophages elicited by 72-hour TG stimulation; n = 6 in two independent experiments. d Representative images of TG-elicited MT4+/+ or MT4–/– mouse peritoneal macrophages treated with cycloheximide (100 μg ml−1) for 6 h and labeled for Itgam (white) and cleaved-caspase 3 (green) and Hoechst (blue, nuclei); scale bar, 20 µm. Quantification of the percentage of cleaved-caspase 3-positive cells is shown on the right; n = 3 in one experiment. e Representative flow cytometry histogram plot of CD36 staining in TG-elicited MT4+/+ or MT4–/– mouse peritoneal macrophages (left) and quantification of normalized MFI (right); n = 6 in two independent experiments. f MFI of AcLDL-FITC binding to TG-elicited MT4+/+ or MT4–/– mouse peritoneal macrophages for the indicated times; n = 6 in two independent experiment. Data were tested by Student’s t-test in b, c, d, and e, and by two-way ANOVA followed by Bonferroni’s post test in f. Results are expressed as mean ± SEM. *p < 0.05, **p < 0.01, and ***p < 0.001

