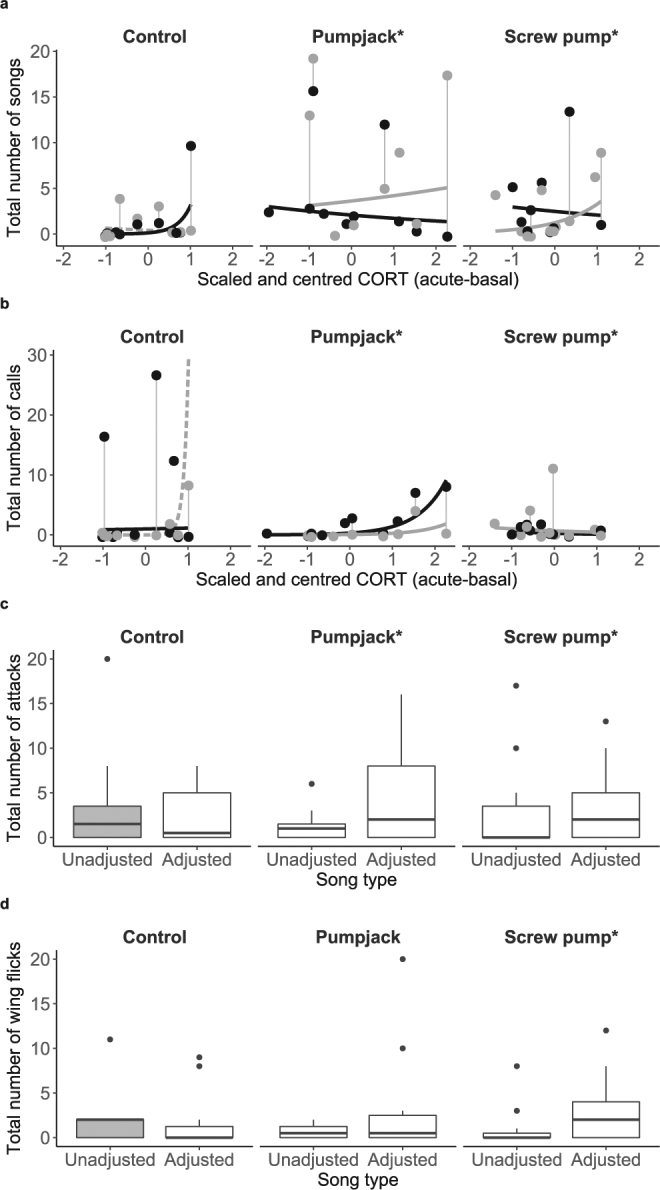
Figure 2.

Responses to acoustically appropriate songs varied with treatment and adrenocortical responsiveness. Panels marked *show significant interactions from Table 1: three-way (a,b) or two-way (c,d) interactions relative to reference (unadjusted song at control sites). Reference (unadjusted songs in control sites) shown by grey dashed line and grey-filled box plots. (a,b), Vertical lines connect playbacks for each individual. Remaining lines (model-predicted values for treatments) and symbols (one playback) are responses to unadjusted (grey) or adjusted (black) songs. (a), songs. (b), calls. (c,d), box plots showing quartiles, median and outliers (dots) by song and infrastructure type for (c), attacks. (d), wing flicks.
