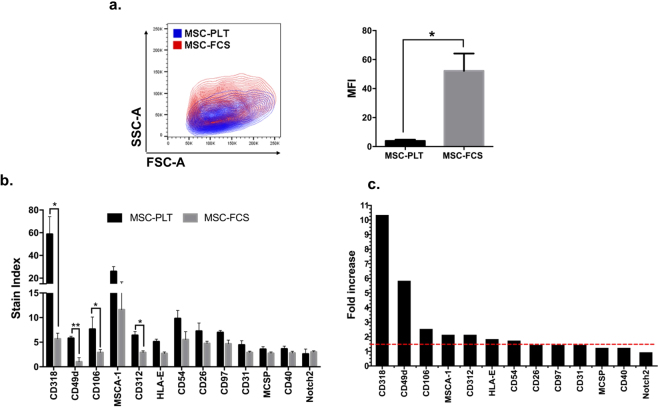
Figure 4.
Stain index of enriched surface proteins in MSC-PLT. (a) Representative contour plot of paired MSC samples with MSC-PLT displaying smaller size and lower complexity than MSC-FCS. MSC-FCS showed significantly higher background fluorescence, herein defines as median fluorescence intensity (MFI), in the APC channel, than MSC-PLT. (b) Stain index of 13 surface proteins enriched on MSC-PLT, in comparison with MSC-FCS (n = 3); error bars represent mean ± SEM and *p-value < 0.05. (c) Fold increase in stain index shown as MSC-PLT relative to MSC-FCS). Red line represents a fold increase of 1.5.

