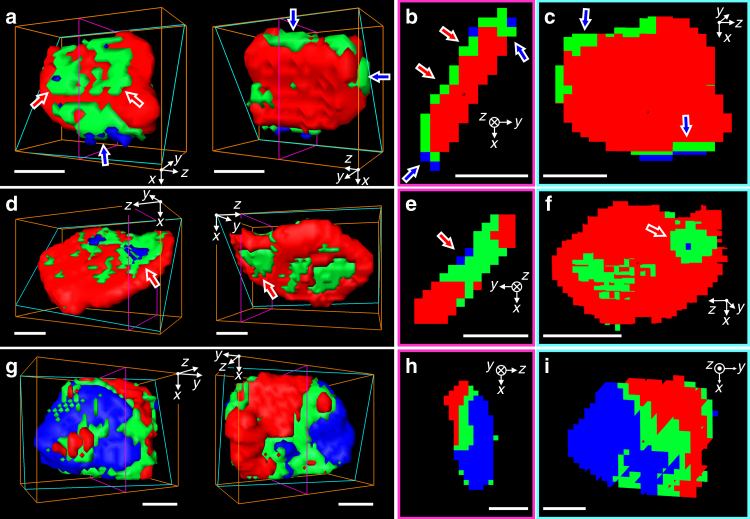
Fig. 4.
Representative three-dimensional (3D) chemical phase distribution of individual particle. a, d, g, Front (left) and backside (right) views of isosurface of three chemical components. Cross-sectional views along the thickness direction (b, e, h) and along the large face (c, f, i), respectively. The cross-section planes are indicated as magenta and cyan colored boxes in 3D isosurface plots. The red, green, and blue indicate LFP-rich, mixed, and FP-rich voxels, respectively. The positions of each particle are noted as (I), (II), and (III) in Fig. 3a for a, d and g, respectively. All scale bars, 50 nm

