Figure 1.
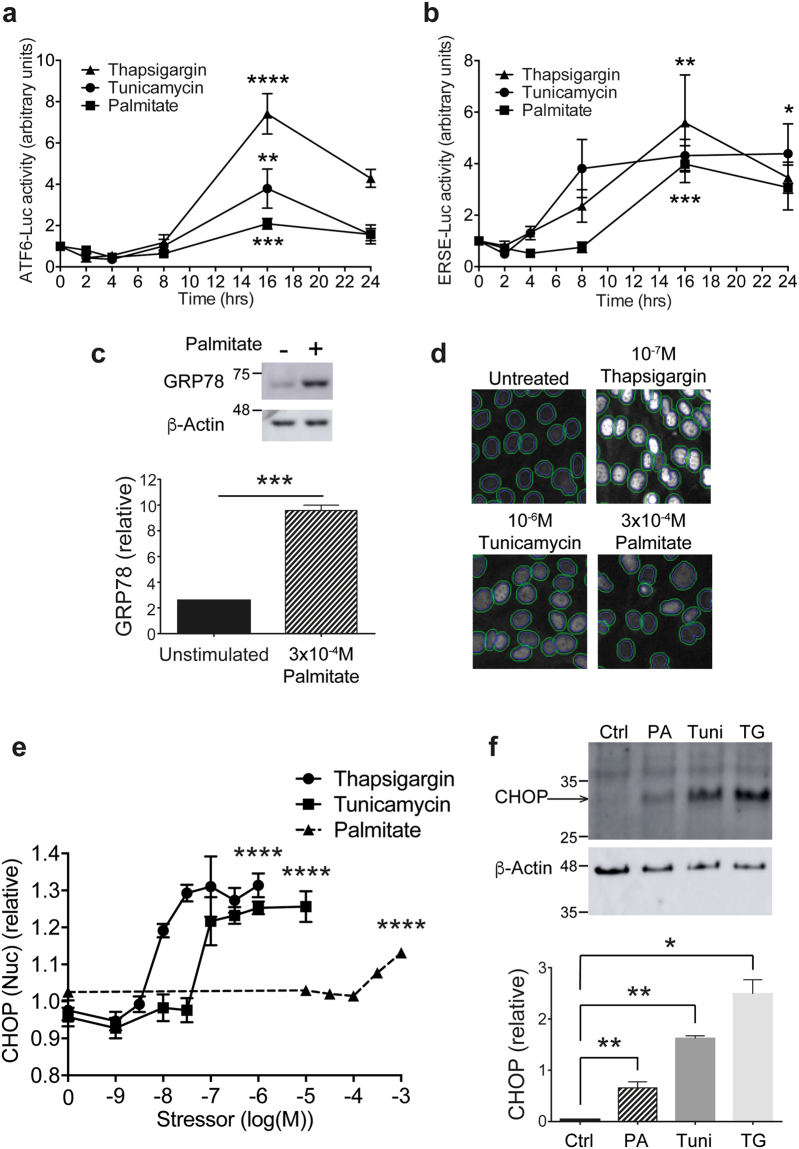
Stimulation of ER stress in podocytes. (a) ATF6-luciferase activity monitored after treatment with 2, 4, 8, 16 or 24 hr 100 nM thapsigargin, 1 µM tunicamycin or 300 µM palmitate (n = 4). One-way ANOVA, thapsigargin ****p < 0.0001, tunicamycin **p = 0.0012, palmitate ****p = 0.0009. A Tukey’s post-hoc comparison comparing each timepoint to 0 hr revealed statistical significance at 16 hr (****) and 24 hr (**) for thapsigargin treatment, at 16 hr (**) for tunicamycin, and at 16 hr (*) for palmitate. (b) ERSE-luciferase activity monitored after treatment with 2, 4, 8, 16 or 24 hr 100 nM thapsigargin, 1 µM tunicamycin or 300 µM palmitate (n = 4). One-way ANOVA thapsigargin *p = 0.0122, tunicamycin **p = 0.0043, palmitate ***p = 0.0001. A Tukey’s post-hoc comparison comparing each timepoint to 0 hr revealed statistical significance at 16 hr (*) thapsigargin treatment, and at 16 hr (**) for palmitate. (c) Representative western blot of the increase in GRP78 expression observed when podocytes were treated with 300 µM palmitate. Densitometric quantification normalised to β-actin (n = 3). Paired t test, ***p < 0.001. (Full blot shown in Supplementary Fig. 3). (d) Representative images of the CHOP immunoassay acquired with the IN Cell Analyzer. DAPI staining in the blue channel was used to segment the nuclei and was then mapped onto the green channel (CHOP immunofluorescence), shown by the inner line, and CHOP fluorescence intensity in the nucleus quantified. (e) CHOP nuclear intensity in podocytes relative to vehicle controls exposed to 10−9-10−6 M Thapsigargin, 10−9-10−5 M Tunicamycin or 10−5-10−3 M Palmitate (n = 3). Log EC50 values were −8.14 for Thapsigargin, −7.22 for Tunicamycin and −2.73 for Palmitate. AFU, arbitrary fluorescence units. One-way ANOVA, thapsigargin ****p < 0.0001, tunicamycin ****p < 0.0001, palmitate ****p < 0.0001. A Tukey’s post-hoc comparison comparing each stressor concentration to unstimulated controls revealed statistical significance at 10−8 M (**) and 10−7.5-10−6 M (****) for thapsigargin, 10−7-10−6.5 M (***) and 10−6-10−5 M (****) for tunicamycin, and 10−3.5 M (**) and 10−3 M (****) for palmitate. (f) Representative western blot for CHOP with densitometric quantification (n = 3), using the same antibody as used for immunofluorescence in (e). WT podocytes untreated or treated for 24 hr with 100 nM thapsigargin (‘TG’), 1 µM tunicamycin (‘Tuni’), or 300 µM palmitate (‘PA’). Paired t test, *p < 0.05, **p < 0.01.

