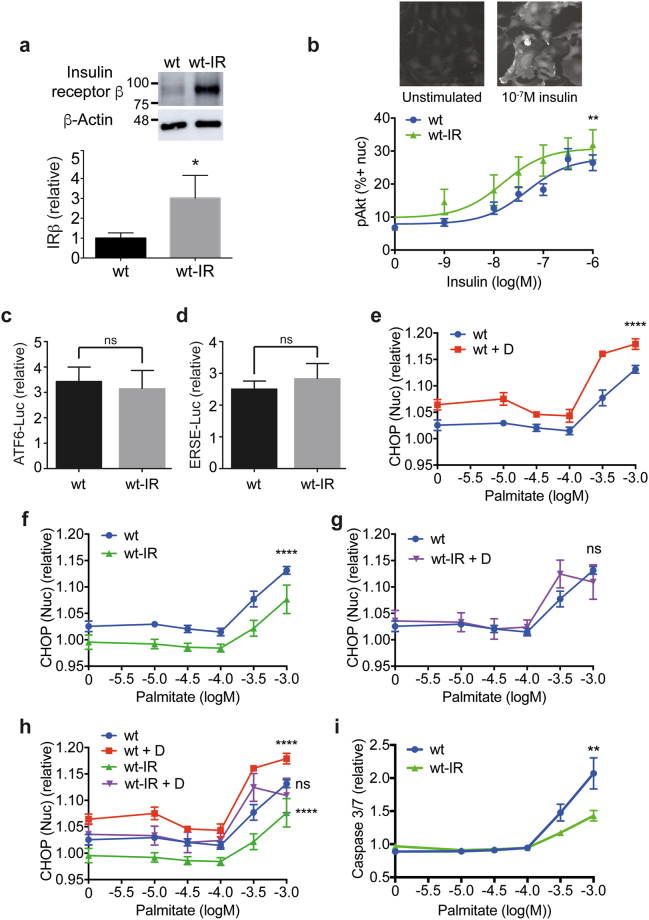
Figure 2.
IR over-expression protects against ER stress. (a) Representative western blot with densitometric quantification normalised to β-actin (n = 3) showing IRβ subunit expression is increased 3-fold in wt-IR podocytes compared with wt cells. Unpaired t test, *p = 0.0153. (Full blot shown in Supplementary Fig. 3). (b) Insulin sensitivity monitored by pAkt immunostaining in podocytes following 10−9-10−6 M insulin stimulation with representative images for wt-IR podocytes unstimulated or stimulated with 10−7 M insulin for 10 min. 10 and 15 minute timepoints were combined (n = 8), and the data expressed as the percentage of cells positive for pAkt in the nucleus. Two-way ANOVA, effect of IR over-expression **p = 0.0057, effect of insulin concentration ****p < 0.0001, with no significant interaction between the effect of IR over-expression and insulin concentration. A Bonferroni post-hoc comparison revealed no significant difference between wt and wt-IR cells at each insulin concentration. (c) ATF6-driven luciferase activity for wt and wt-IR podocytes treated with diabetic media relative to normal growth media. Unpaired t test with Welch’s correction (n = 6), not significant, ‘ns’. (d) ERSE-driven luciferase activity for wt and wt-IR podocytes treated with diabetic media relative to normal growth media. Unpaired t test with Welch’s correction (n = 6), not significant, ‘ns’. (e) CHOP response to 10−5-10−3 M palmitate for podocytes differentiated in normal growth media or diabetic media (‘D’), (n = 3). Two-way ANOVA, effect of palmitate concentration ****p < 0.0001, effect of diabetic media ****p < 0.0001, with a significant interaction between palmitate concentration and diabetic media *p = 0.0330. A Bonferroni post-hoc comparison comparing podocytes differentiated in normal growth media or diabetic media revealed statistical significance at 0 M (*), 10−5.5 M and 10−3 M (**), and 10−3.5 M (****) palmitate. (f) CHOP response to 10−5-10−3 M Palmitate, wt podocytes compared to wt-IR, (n = 3). Two-way ANOVA, effect of IR over-expression ****p < 0.0001, effect of palmitate concentration ****p < 0.0001, with no significant interaction between the effect of IR over-expression and palmitate concentration. A Bonferroni post-hoc comparison comparing wt and wt-IR podocytes revealed statistical significance at 10−3.5-10−3 M (*) palmitate. (g) CHOP response to palmitate for wt podocytes compared with wt-IR treated with diabetic media, (n = 3). Two-way ANOVA, effect of palmitate concentration ****p < 0.0001, but no significant effect of wt compared with wt-IR + D. (h) Composite graph of curves shown in (e,f) and (g). (i) Caspase 3/7 activation as a measure of apoptosis in wt and wt-IR podocytes following 24 hr palmitate treatment (n = 3). Two-way ANOVA, effect of IR over-expression **p = 0.0044, effect of palmitate ****p < 0.0001, with a significant interaction between IR over-expression and palmitate dose ****p < 0.0001. A Bonferroni post-hoc comparison comparing wt and wt-IR revealed statistical significance at 10−3 M palmitate (****).

