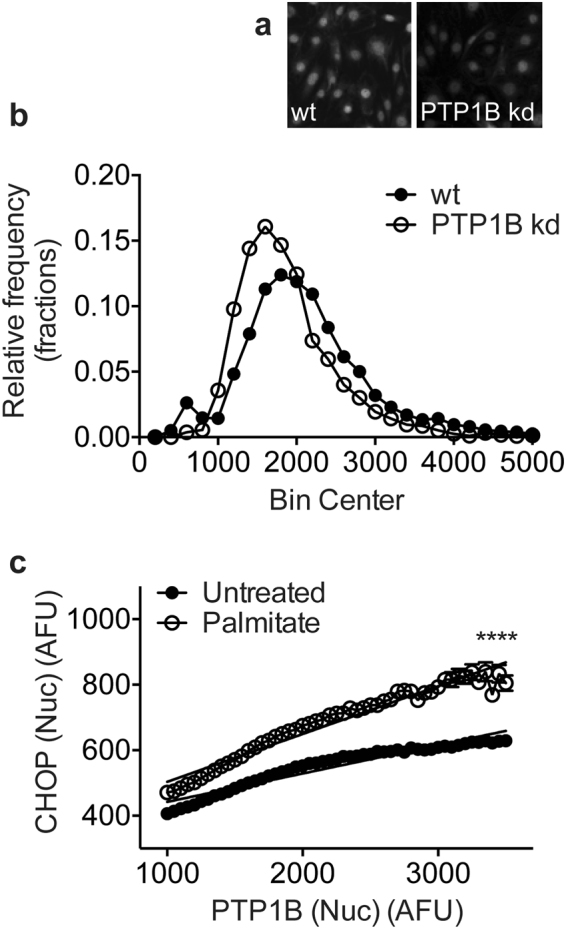
Figure 4.

The amount of PTP1B in podocytes positively correlates with ER stress. WT and PTP1B kd cells untreated or treated with 300 µM palmitate were stained for CHOP, PTP1B and with DAPI. (a) Immunofluorescent staining of wt and PTP1B kd cells for PTP1B. (b) Frequency distribution plot of unadjusted PTP1B intensity values for single cells sorted into 50-AFU bins. (c) Nuclear PTP1B and CHOP paired single cell values were sorted based on the amount of PTP1B into 50-AFU bins. WT and PTP1B kd cells were combined in silico to yield a wide range of PTP1B intensity values for cells untreated or palmitate-treated. Within each bin, the mean CHOP value was calculated and plotted. Linear regression analysis showed that both slopes were significantly non-zero, p < 0.0001. R2 = 0.92 for untreated podocytes and 0.95 for palmitate-treated. Two-way ANOVA, effect of PTP1B expression ****p < 0.0001, effect of palmitate treatment ****p < 0.0001, with a significant interaction between PTP1B expression and palmitate treatment ****p < 0.0001. Bonferroni post-hoc comparison comparing row means (CHOP expression without or with palmitate treatment for each value of PTP1B) revealed means were significantly different (****p < 0.0001) for each value of PTP1B.
