Fig. 1.

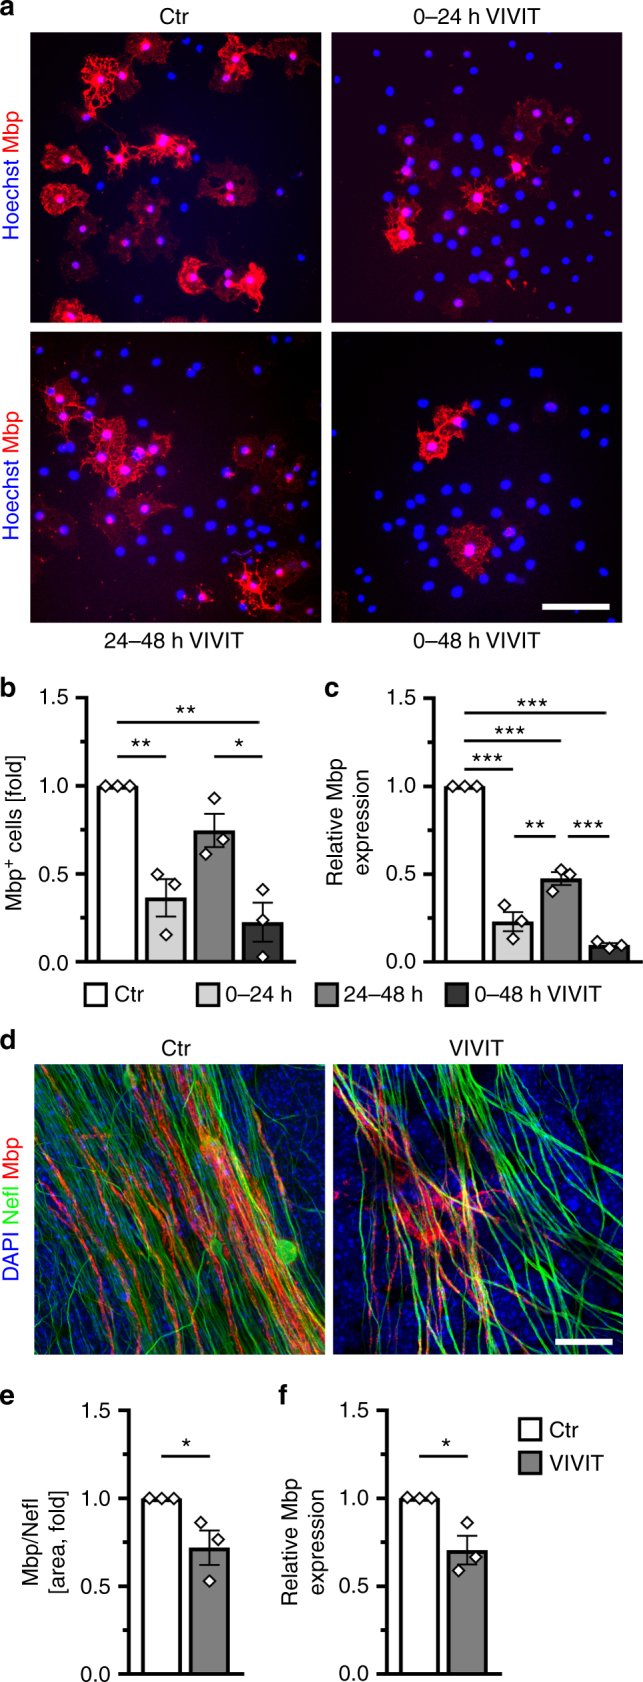
Nfat/calcineurin signaling is required for oligodendroglial differentiation in culture. a–c Analysis of myelin gene expression in primary mouse oligodendroglial cells cultured for 48 h under differentiating conditions in the absence (Ctr, open bar) or presence of 1 µM VIVIT (VIVIT, grey bars). Incubation with VIVIT was restricted to the first 24 h (light grey bars) or second 24 h (grey bars) of incubation or throughout the whole cultivation period (dark grey bars). Cultures were stained with antibodies directed against Mbp (red) and counterstained with Hoechst (blue). Scale bar, 50 µm (a). From immunocytochemical stainings the fraction of Mbp-positive cells was determined (b) (n = 3). The relative number of Mbp-positive cells present under control conditions was arbitrarily set to 1 and used to normalize in pairwise fashion (values: 1 for control conditions, 0.37 ± 0.11 for VIVIT treatment during the first 24 h, 0.75 ± 0.09 for VIVIT treatment during the second 24 h, 0.23 ± 0.11 for 48 h VIVIT treatment). RNA from these cultures was also used to perform qrtPCR and determine Mbp levels (c) (n = 3). The amount of Mbp transcripts present after 48 h under control conditions was arbitrarily set to 1 and used to normalize (values: 1 for control conditions, 0.23 ± 0.10 for VIVIT treatment during the first 24 h, 0.48 ± 0.06 for VIVIT treatment during the second 24 h, 0.10 ± 0.02 for 48 h VIVIT treatment). d–f Analysis of myelination in cerebellar slices of newborn mice after 12 days of culture in the absence (Ctr, open bars) and presence (VIVIT, grey bars) of 1 µM VIVIT (n = 3). Cultures were stained (d) with antibodies directed against Mbp (red) and Neurofilament L (Nefl, green) and counterstained with DAPI (blue). Scale bar, 20 µm. The extent of myelination was assessed by determining the Nefl-positive area co-stained with Mbp (e). The Mbp/Nefl ratio under control conditions was arbitrarily set to 1 and used to normalize in pairwise fashion (values: 1 for control conditions, 0.72 ± 0.09 for VIVIT treatment). RNA prepared from these cultures was used to determine Mbp and Nefl expression (f). The amount of Mbp relative to Nefl transcripts under control conditions was arbitrarily set to 1 (values: 1 for control conditions, 0.71 ± 0.08 for VIVIT treatment). Statistical significance was determined by Bonferroni-corrected one-way ANOVA in (b) and (c) and two-tailed Student’s t-test in (e) and (f) (*P ≤ 0.05; **P ≤ 0.01; ***P ≤ 0.001)
