Fig. 6.
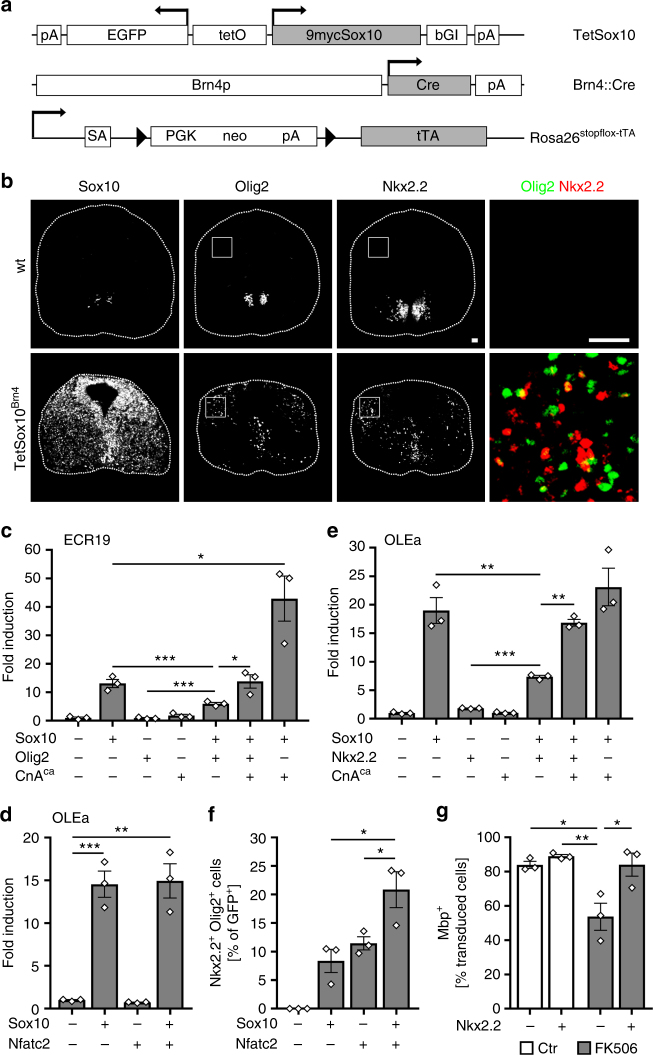
Nfat proteins overcome cross-repression of Olig2 and Nkx2.2 in cooperation with Sox10. a TetSox10, Brn4::Cre and Rosa26stopflox-tTA alleles for CNS overexpression of Sox10. Arrows mark transcription start sites, triangles loxP sites. 9mycSox10, myc-tagged Sox10 coding sequences; bGI β-globin intron, Brn4p Brn4 promoter, Cre Cre coding sequences, EGFP enhanced GFP coding sequences, neo neomycin resistance cassette, pA polyadenylation site, PGK phosphoglycerate kinase promoter, SA splice acceptor, tetO bidirectional tetracycline-responsive promoter, tTA tetracycline-controlled transactivator coding sequences. b Immunohistochemistry for Sox10, Olig2, and Nkx2.2 on transverse spinal cord sections of wildtype (wt) and Sox10 overexpressing (TetSox10Brn4) embryos at 12.5 dpc. Right panels are magnifications of boxed areas with Olig2 in green and Nkx2.2 in red. Scale bars, 50 µm. c N2a cell transfections with ECR19 luciferase reporter in absence (−) or presence (+) of Sox10, constitutively active CnA (CnAca) and Olig2 (n = 3). Fold inductions ± SEM were determined after 48 h with reporter activity in the absence of effectors set to 1 (values: 13.1 ± 1.4 for Sox10, 0.9 ± 0.2 for Olig2, 1.8 ± 0.5 for CnAca, 6.0 ± 0.5 for Sox10 and Olig2, 13.9 ± 2.4 for Sox10, Olig2 and CnAca, and 42.9 ± 7.9 for Sox10 and CnAca). d N2a cell transfections with Olig2 OLEa luciferase reporter in absence (−) or presence (+) of Sox10 and Nfatc2 (n = 3) (14.6 ± 1.7 for Sox10, 0.7 ± 0.0 for Nfatc2 and 14.9 ± 2.0 for Sox10 and Nfatc2) or (e) in absence (−) or presence (+) of Sox10, CnAca and Nkx2.2 (n = 3) (values: 19.0 ± 2.3 for Sox10, 1.8 ± 0.1 for Nkx2.2, 1.0 ± 0.1 for CnAca, 7.3 ± 0.3 for Sox10 and Nkx2.2, 16.9 ± 0.6 for Sox10, Nkx2.2 and CnAca, and 23.1 ± 3.3 for Sox10 and CnAca). f Neural tube electroporations in HH11-stage chicken embryos (n = 3) and quantification of the relative number of electroporated cells, in which joint expression of Nkx2.2 and Olig2 was induced after 48 h (values: 0 for control, 8.4 ± 3.5 for Sox10, 11.5 ± 2.0 for Nfatc2, and 20.9 ± 5.4 for Sox10 and Nfatc2). g Immunohistochemical determination of the percentage of Mbp-expressing rat oligodendroglia transduced with GFP-expressing control (−) or Nkx2.2-overexpressing retrovirus (+), after 6 days of differentiation in absence (Ctr, open bars) or presence of 1 µM FK506 (grey bars) (n = 3 separate cultures). (Values: 84.0 ± 3.6% in GFP-transduced untreated cultures; 89.0 ± 1.7% in Nkx2.2-transduced untreated cultures; 53.7 ± 13.7% in GFP-transduced FK506-treated cultures; 84.1 ± 11.7% in Nkx2.2-transduced FK506-treated cultures). Statistical significance was determined by two-tailed Student’s t-test (c–f) and Bonferroni-corrected one-way ANOVA (g) (*P ≤ 0.05; **P ≤ 0.01; ***P ≤ 0.001)

