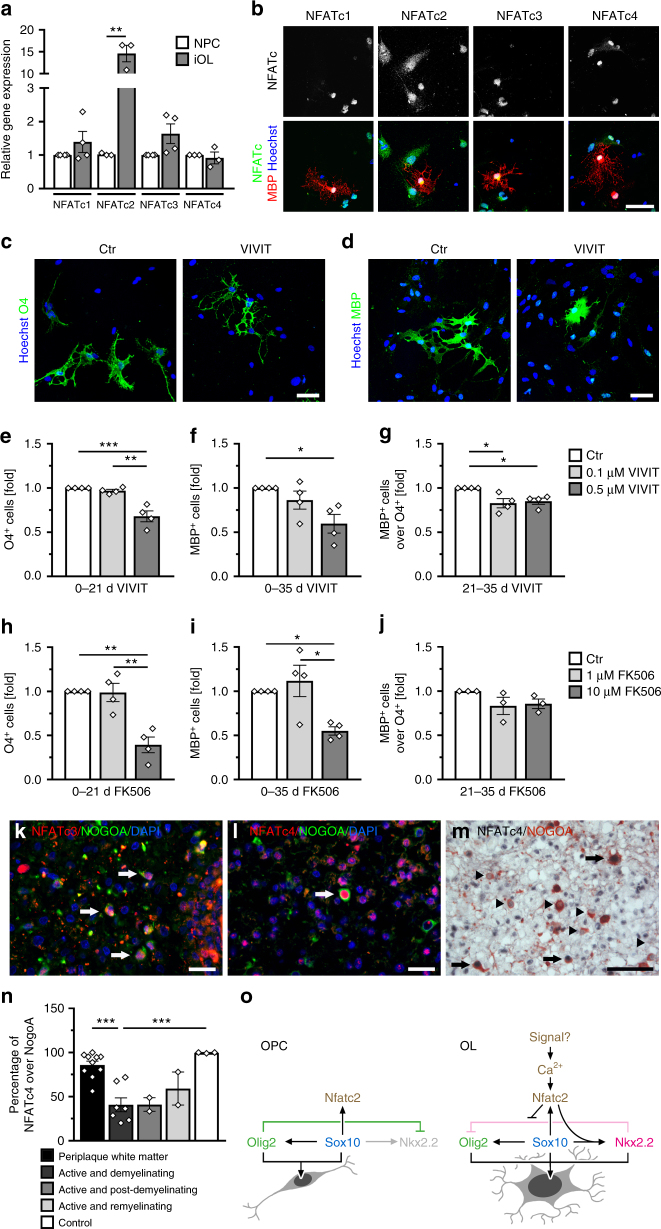
Fig. 7.
NFATs are relevant in human oligodendrocytes. a NFAT expression in human iOLs (grey bars) and NPCs (open bars) by qrtPCR after normalization to GAPDH. Average NFAT levels in NPCs were set to 1 (NFATc1: 1.4 ± 0.3; NFATc2: 14.6 ± 1.9; NFATc3: 1.6 ± 0.3 and NFATc4: 0.9 ± 0.2). b Immunocytochemistry of MBP-positive (red) iOL with antibodies directed against NFATs (white in upper row, green in lower row); counterstaining with Hoechst dye (blue). c–g Analysis of differentiating iOL cultured 21 (c, e, h) or 35 days (d, f, g, i, j) in absence (Ctr, open bars) or presence of 0.1 (light grey bars) to 0.5 µM (dark grey bars) VIVIT (c–g, n = 4) or 1 (light grey bars) to 10 µM (dark grey bars) FK506 (h–j, n = 3–4). VIVIT/FK506 incubation was continuous (c–f, h, i) or from days 21–35 (g, j). Cultures were stained with anti-O4 (green, c) and anti-MBP antibodies (green, d). From staining and FACS analysis (see Suppl. Fig. 7c, d) the fraction of O4-positive cells after 21 days (e, h) and MBP-positive cells after 35 days (f, i) was determined. For treatment during days 21–35, the fraction of FACS-sorted O4-positive cells was determined that had reached a MBP-positive stage (g, j). The relative number of marker-positive cells under control conditions was set to 1 and used to normalize in pairwise fashion (values: 1 for control, 0.97 ± 0.01 for 21 days 0.1 µM VIVIT, 0.68 ± 0.06 for 21 days 0.5 µM VIVIT, 0.86 ± 0.10 for 35 days 0.1 µM VIVIT, 0.60 ± 0.10 for 35 days 0.5 µM VIVIT, 0.82 ± 0.05 for 0.1 µM VIVIT from days 21–35, 0.86 ± 0.04 for 0.5 µM VIVIT from days 21–35, 0.99 ± 0.21 for 21 days 1 µM FK506, 0.39 ± 0.17 for 21 days 10 µM FK506, 1.12 ± 0.36 for 35 days 1 µM FK506, 0.55 ± 0.09 for 35 days 10 µM FK506, 0.83 ± 0.17 for 1 µM FK506 from days 21–35 and 0.86 ± 0.10 for 10 µM FK506 from days 21–35). k–n NFAT immunohistochemistry in human brain tissue. Antibodies directed against NFATc3 and NFATc4 (red in k and l, black in m) were combined with anti-NOGOA antibodies (green in k and l, red in m). Arrows mark double positive cells, arrowheads NOGOA-positive oligodendrocytes without NFATc4. n Percentage of NOGOA-positive oligodendrocytes with nuclear NFATc4 in periplaque white matter (86 ± 4%), active and demyelinating lesions (41 ± 8%), active and post-demyelinating lesions (41 ± 8%), active and remyelinating plaques (59 ± 19%), and control CNS tissue (99 ± 1%). o Model of oligodendroglial Nfat action. Statistical significance was determined by two-tailed Student’s t-test (a) or Bonferroni-corrected one-way ANOVA (e–j, n) (*P ≤ 0.05; **P ≤ 0.01; ***P ≤ 0.001). Scale bars, 50 µm

