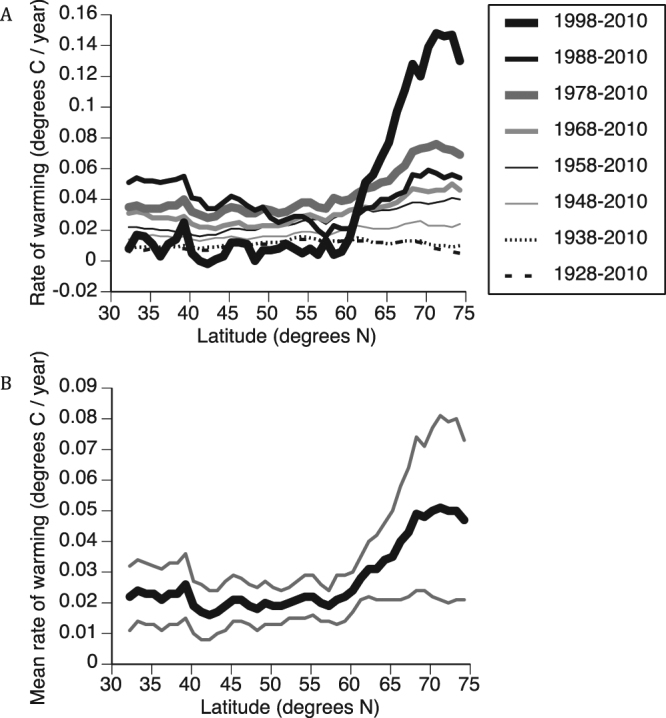
Figure 3.

(A) Variation in the relationship between rate of Northern Hemisphere springtime land surface warming and latitude among successively more recent decadal periods beginning in 1928, coinciding with the periods encompassed by the studies upon which estimates of phenological trends used in this analysis have been based. (B) The mean rate (heavy line) and upper- and lower 95% confidence limits (thin lines) of Northern Hemisphere springtime land surface warming calculated across all periods in panel (A).
