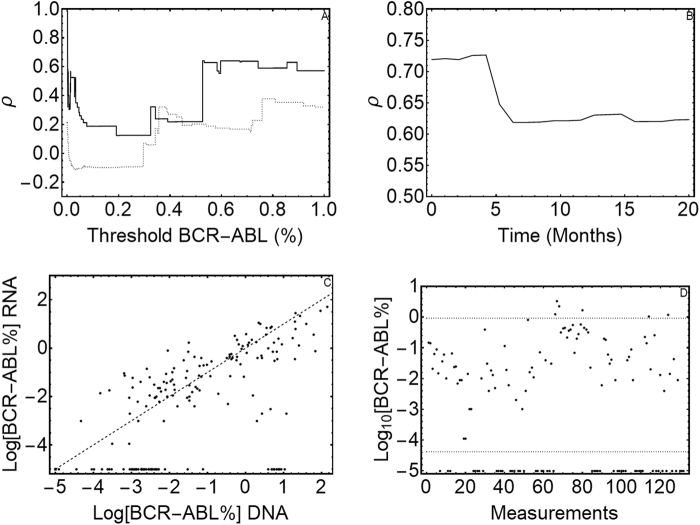
Fig. 3. Statistical analysis between DNA and RNA measures.
a The correlation between the two methods used for CML samples analysis. On x axis are reported the DNA values, while y axis represents the mRNA values. The dashed line is the equality line (X = Y). If there was no or little differences between DNA and RNA measures, the values should have followed the equality line. Our results are clearly not correlated. b The agreement between DNA and RNA values. The area comprised between the two dashed lines represents the 95% confidence interval of DNA values (not null) after 9 months of therapy. Dots represents the mRNA values coupled to DNA ones. Only 56% of mRNA values falls within the DNA confidence interval, but the 89% of measures outside this confidence interval are undetectable mRNA values. c The correlation between DNA and RNA values over time. On the x axis is the time (expressed in months), while on the y axis is the correlation (ρ) value. We observe a decrease in correlation between 100 and 200 days of therapy, which correspond to the decay of cells’ number under 1%. d The conditionate correlation vs. a threshold value. On x axis is the threshold value, while y axis is the correlation (ρ) value. The solid line represents the DNA threshold, while the dashed line represents the mRNA threshold. When we choose DNA as a threshold and we consider undetectable values, DNA and mRNA showed 100% correspondence; but we obtained a very low correlation in all the other follow-ups

