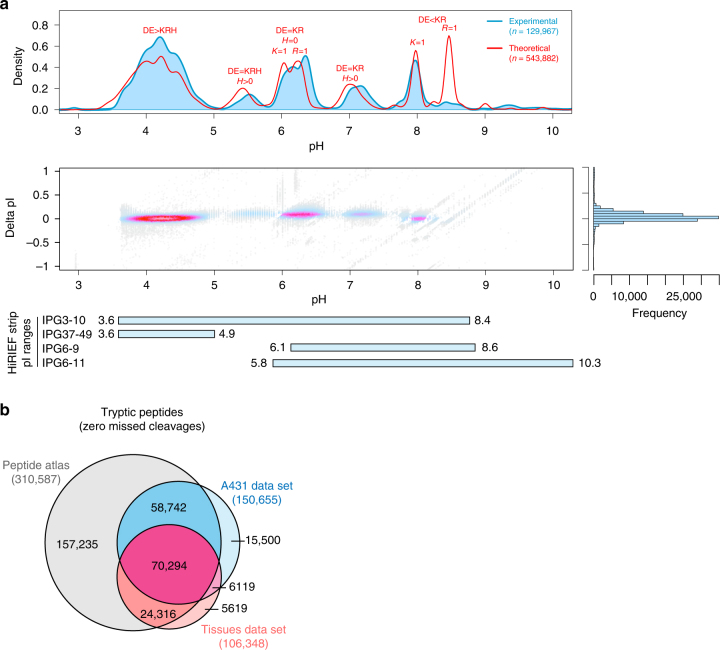
Fig. 1.
Full pI range (3–10) HiRIEF provides broad peptidome and proteome coverage. a The top panel shows the comparison between experimental and theoretical pI distributions of TMT-labeled peptides from the A431 cell line data set. The six major peaks in the theoretical pI distribution represent groups of peptides with characteristic amino acid compositions. For example, peptides with a higher number of Asp (D) and Glu (E) residues than the total number of Lys (K), Arg (R), and His (H) will have a pI between 3.5 and 5. The middle panel shows the accuracy of pI prediction by the PredpI algorithm1 across the full pI range. The bottom panel shows the experimental pI ranges of the four IPG strips employed in this study. Nominal pH ranges are indicated on the left side with actual pH ranges next to the bars. See Supplementary Figures 4, 6, and 7 for pI fraction resolution, reproducibility and yield. b Overlap of identified fully tryptic human peptides (at protein level FDR 1%) between the A431 cells data set, the normal tissues data set and the public peptide repository PeptideAtlas (release 2017-01)

