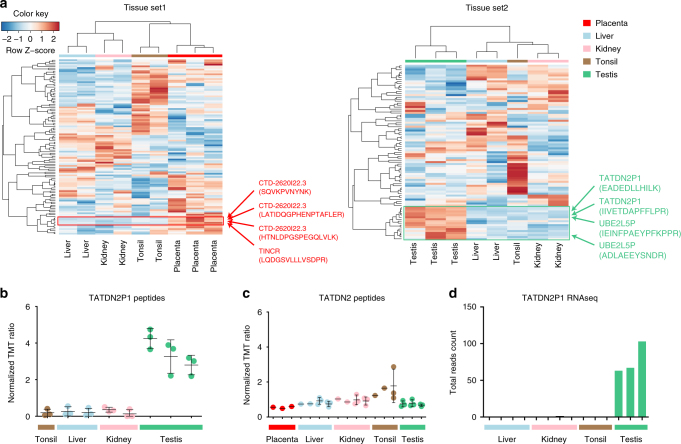
Fig. 6.
Quantitative analysis of novel peptides identified in the normal tissues data set. a Novel peptide tissue expression. Pearson correlation and complete linkage method was used for clustering. Row Z-scores are shown in the heat map. b TMT-based tissue quantification of the pseudogene TATDN2P1 peptides points to testis specificity. The three dots in the TMT ratio plots indicate quantification of three individual PSMs, with the center bar as the mean and error bars as standard deviation. c TMT-based tissue quantification of TATDN2 peptides indicates broad tissue expression (quantification values from three PSMs). d RNA-seq read counts of TATDN2P1 in different tissues confirms testis specificity

