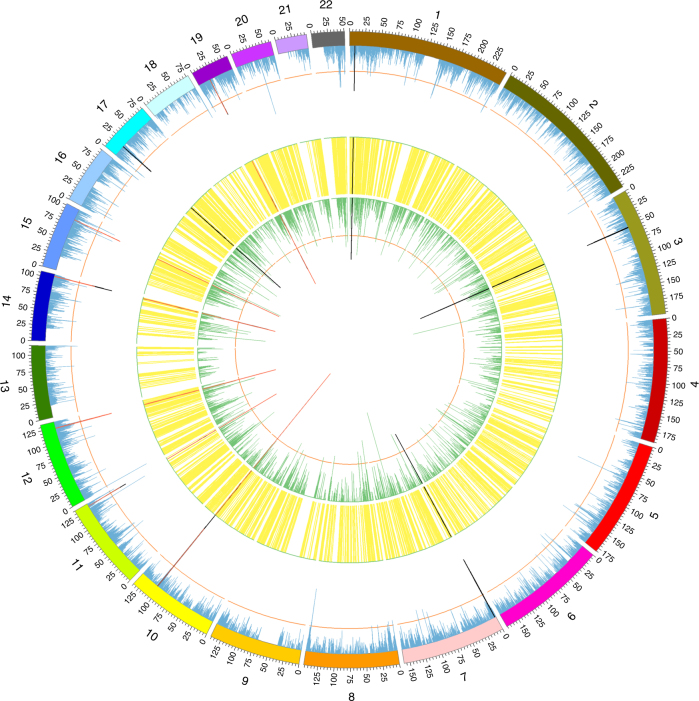
Fig. 3.
Pinpointing functional regions for a complex trait with consistent SMR association signals across multi-omics layers. Shown are −log10 (P-values) from the SMR tests for schizophrenia against the physical positions of DNAm or gene expression probes. The blue lines (outer ring) represent −log10 (P-values) from the SMR tests for associations between DNA methylation and trait, the green lines (inner ring) represent those for the associations between transcripts and trait and the yellow lines (middle ring) represent the significant associations between methylations and transcripts. The orange circles represent the significance thresholds of the SMR tests. The black lines are the significant SMR associations consistent across all three layers, and the red lines highlight the significant and consistent SMR associations that are not rejected by the HEIDI test. Due to the large scale of the plot, DNAm and genes that are distally associated (e.g. >500 kb and <2 Mb) appear to be closely located in the figure

