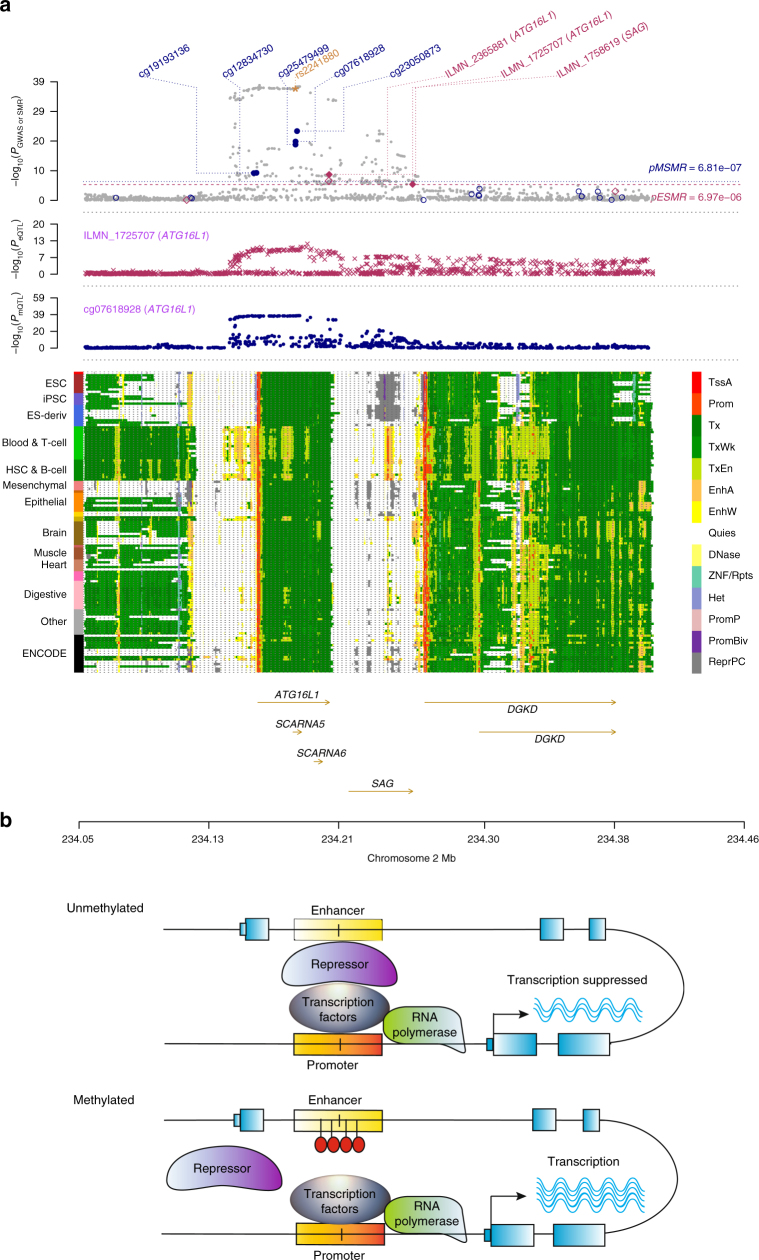
Fig. 5.
Prioritizing genes and regulatory elements at the ATG16L1 locus for Crohn’s disease (CD) with a plausible regulation mechanism. a Results of SNP and SMR associations across mQTL, eQTL and GWAS. The top plot shows −log10(P-values) of SNP from the GWAS meta-analysis for CD40. The red diamonds and blue circles represent –log10(P-values) from the SMR tests for associations of gene expression and DNAm probes with CD, respectively. The solid diamonds and circles represent the probes not rejected by the HEIDI test. The yellow star indicates the previously reported causal variant rs2241880. The second plot shows −log10(P-values) of the SNP associations for gene expression probe ILMN_1725707 (tagging ATG16L1). The third plot shows −log10(P-values) of the SNP associations for DNAm probe cg07618928. The bottom plot shows 14 chromatin state annotations (indicated by colours) of 127 samples from REMC for different primary cells and tissue types (rows). b A hypothetical regulation mechanism. When the DNAm site in the enhancer is unmethylated, repressors can bind to the enhancer, decrease the activity of the promoter, and thus suppress the transcription of the ATG16L1 gene. When the DNAm site is methylated (by the effect of the genetic variant rs2241880 in the enhancer), the binding of repressors is disrupted, which prevents the transcription of ATG16L1 from suppression

