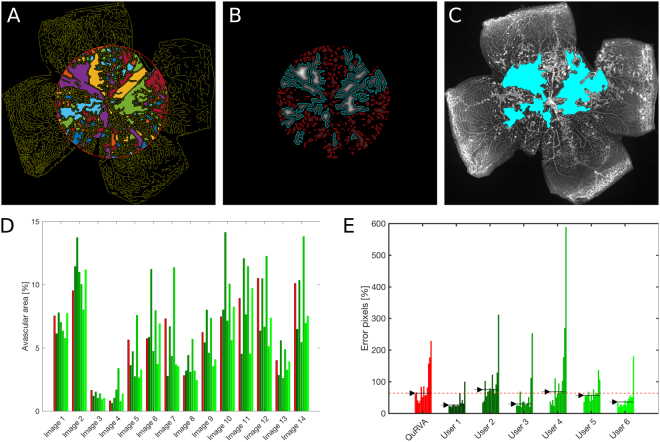
Figure 6.
Computation of avascular zones. (A) Vasculature skeleton and avascular regions, defined as 8-connected background objects within the circular region of interest (red circle), displayed in random colours for better visibility. (B) Grey-scale-coded distance to the closest skeleton pixel. Cyan contours indicate regions enclosing pixels which maximal distance to the skeleton is larger than 1% of Φretina. Remaining avascular regions are contoured in red. (C) Resulting avascular region overlapped with original image. (D) Avascular area computed by QuRVA (red) and manual segmentations (shades of green), for each image of the image set. Note that the value of the automatic algorithm lies within the range of manual segmentations for the vast majority of the images. (E) Percent fraction of retinal pixels that are either false positive or false negative, according to the consensus of manual evaluators, for all images and grouped by user. Arrows indicate the median value across images for each evaluator, and the dashed red line indicates the median error for QuRVA, which is similar to manuals.

