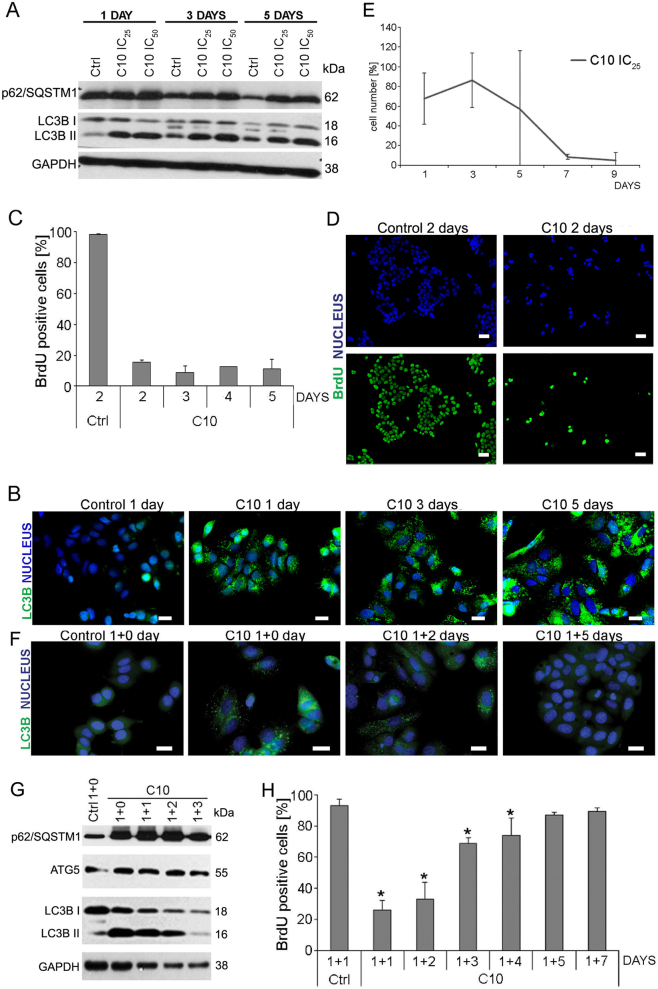
Fig. 2. Cell fate after prolonged and transient treatment with C10.
a–c MCF-7 cells were treated with IC25 (2 µM) or IC50 (3 µM) dose of C10 for the indicate time. a Representative western blots of p62/SQSTM1 and LC3B protein level. b Representative immunofluorescence images of cells stained for LC3B (green) and nuclei with DAPI (blue) (one of 2 independent experiments). Scale bars: 20 µm. c Quantitative analysis of BrdU incorporation in MCF cells and (d) representative immunofluorescence images of BrdU-positive cells (green) and nuclei stained with DAPI (blue) (3 independent experiments). Scale bars: 50 μm. The data were calculated as the percentage of total cell population. e The viability measured by cell counting with trypan blue exclusion. The data were calculated as the percentage of the control. f–h MCF-7 cells were treated with IC50 dose of C10 for 1 + n days. f Representative immunofluorescence images of cells stained for LC3B (green) and nuclei with DAPI (blue) (one of 8 independent experiments). Scale bars: 20 µm. g Representative western blots of ATG5, p62/SQSTM1 and LC3B protein level. h Quantitative analysis of BrdU incorporation in MCF cells (4 independent experiments). Scale bars: 50 μm. The data were calculated as the percentage of total cell population. *P < 0.05 vs. control

