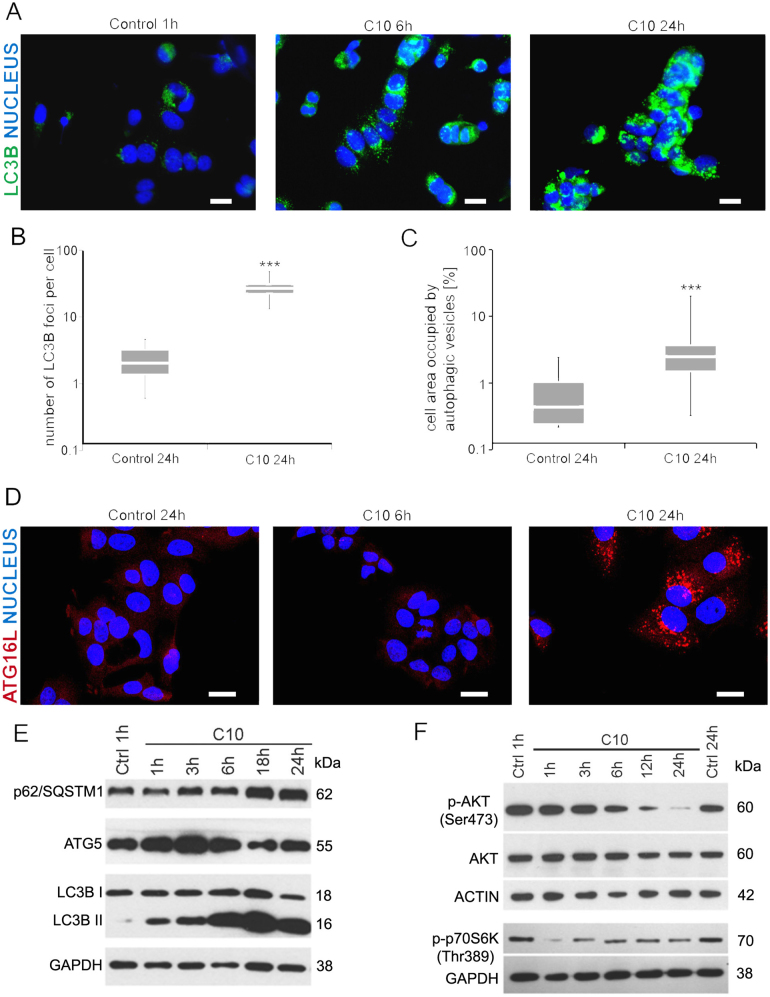
Fig. 3. C10 induces autophagy in MCF-7 cells.
MCF-7 cells were treated with IC50 dose of C10 or vehicle for indicated time. a, d Representative immunofluorescence images of cells stained for LC3B (green) in (a) or ATG16L (red) in (d); nuclei stained with DAPI (blue) (one of 2 or 3 independent experiments for ATG16L and LC3B, respectively). Scale bars: 20 µm. b Quantification of LC3B foci per cell performed using immunofluorescence microscopy. Foci were counted in at least 350 cells in each of 3 independent experiments. The data represent median and IQR. ***P < 0.001 vs. control. c Quantitative analysis of cell area occupied by autophagic vesicles in control cells and cells treated with IC50 dose of C10 based on electron microscopy images. The surface of vesicles in at least 30 cells per sample was counted. The data represent median and IQR. ***P < 0.001 vs. control. e, f Representative western blots showing protein level of (e) p62/SQSTM1, ATG5, LC3B and (f) phospho-AKT (p-AKT), AKT, phospho-p70S6K (p-p70S6K)

