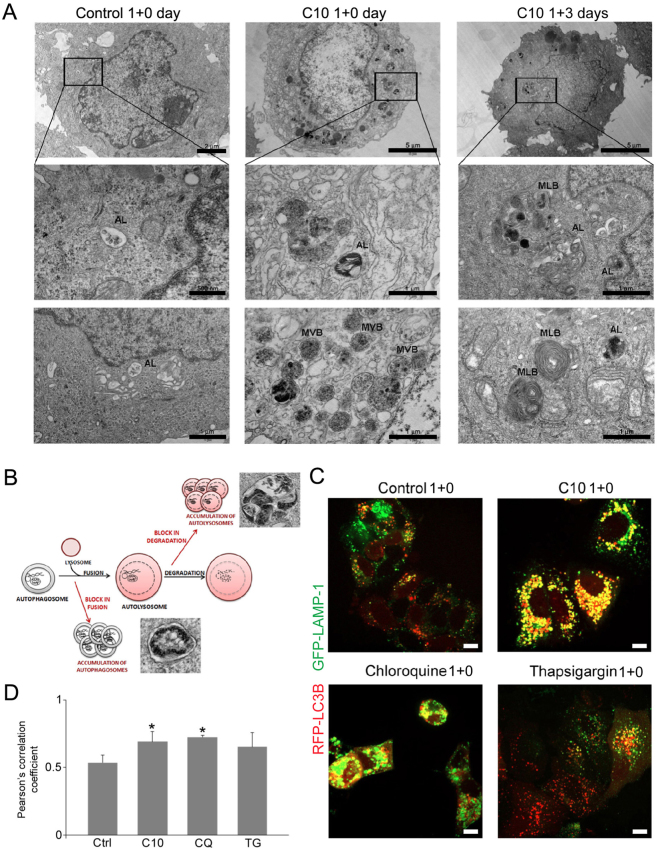
Fig. 5. C10 affects autolysosomal degradation in MCF-7 cells.
a Electron microscopy images of cross-sections of cells treated with IC50 dose of C10 or vehicle for 1 + n days. The images show typical cells on the subsequent days following treatment (upper panel) and their magnified parts with representative autophagic vesicles (lower panels). AL-autolysosome, MVB-multivesicular body, MLB-multilamellar body. b Scheme illustrating possible ways of autophagy blockade at the late stage with representative electron microscopy images of autophagic vesicles. c, d MCF-7 cells were transiently cotransfected with mRFP-LC3B and GFP-LAMP-1 plasmids and cultured in full medium with or without IC50 dose of C10 for 24 h (1 day). Cells treated with 10 µM chloroquine or 5 µM thapsigargin were used as positive and negative controls, respectively. c Representative confocal images of LC3B (red) and LAMP-1 (green) proteins localization (one of 5 independent experiments). Scale bars: 10 µm. d Pearsons’ correlation coefficients for colocalization of LC3B with LAMP-1 (4 independent experiments). CQ-chloroquine, TG-thapsigargin. *P < 0.05 vs. control

