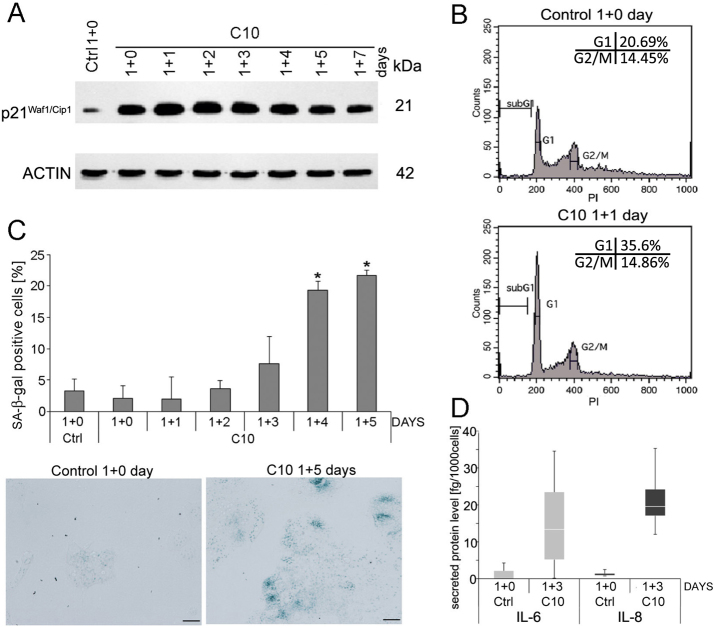
Fig. 6. Transient treatment of C10 induces senescence of MCF-7 cells.
MCF-7 cells were treated with IC50 dose of C10, and subjected to analysis of cellular senescence markers on the 1 + n day of treatment. a Western blot analysis of p21WAF1/CIP1 protein level. b Representative histograms of cell cycle analysis by flow cytometry (one of 3 independent experiments). c Quantitative analysis from 4 independent experiments of SA-β-galactosidase positive cells and representative phase contrast images (blue staining represents SA-β-galactosidase activity). Scale bars: 20 µm. The data were calculated as the percentage of total cell population. *P < 0.05 vs. control. d Quantitative analysis of 4 independent experiments of IL-6 and IL-8 level estimated by flow cytometry. Data represents median and IQR

