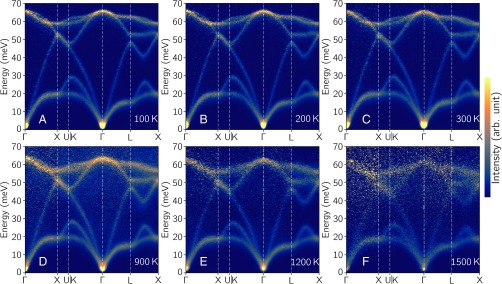
Fig. 1.
Experimental phonon dispersions of silicon. Inelastic neutron scattering data of silicon were measured on the ARCS time-of-flight spectrometer at (A) 100 K, (B) 200 K, (C) 300 K, (D) 900 K, (E) 1,200 K, and (F) 1,500 K. The 4D phonon dynamical structure factors, S(q,), were reduced, multiphonon-subtracted, and “folded” into one irreducible wedge in the first Brillouin zone. Phonon dispersions are shown along high-symmetry lines and through the zone L–X.

