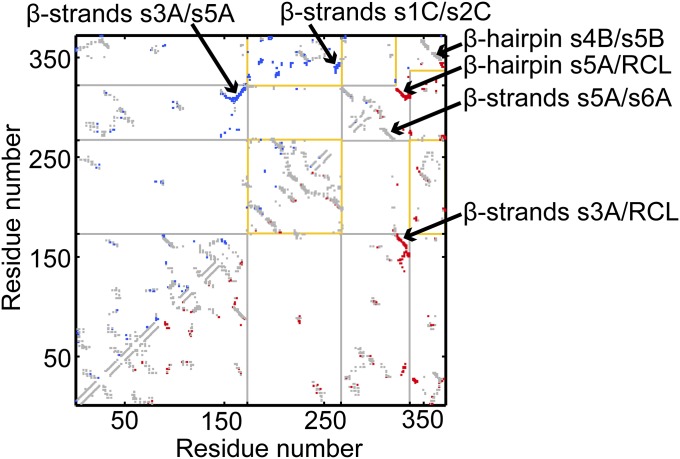
Fig. 3.
Native contact map of the active and latent conformations of α1-AT. In this map, a native contact between residues i and j is marked at (i, j), with residue numbers as the X and Y axes. The native contact maps of the active conformation and the latent conformation are shown in the upper and lower triangles, respectively. Common contacts are in gray, while those unique to the active and latent conformations are in blue and red, respectively. For example, interactions between strands s3A and s5A are unique to the active conformation, while those between strands s5A and RCL, and those between s3A and RCL, are unique to the latent conformation. The latter two sets of contacts form as a result of the insertion of the RCL between s3A and s5A. Contacts of domain 1 are bounded by yellow lines, while those of domain 2 are bounded by gray lines. Contacts which are bounded by both yellow and gray lines are interdomain contacts. The domain boundaries near the RCL are different for the active and the latent conformations and are represented by the incomplete bounding boxes near the C-terminal region of the contact map.

