Fig. 6.
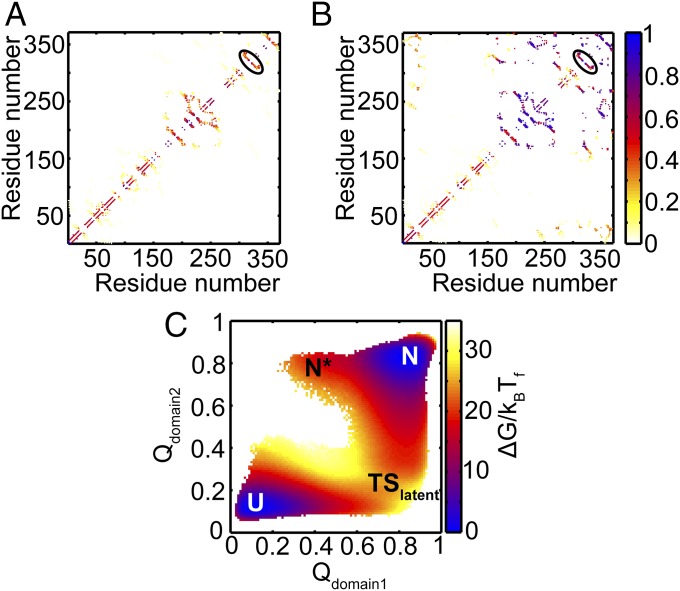
Folding mechanism of latent α1-AT. (A) The average contact map of the near-unfolded ensemble at Q ≈ 0.2 shows that the contacts between β-strand s5A and RCL are already formed (black ellipse). The colors represent the probability of contact formation. (B) The average contact map of the transition state ensemble at Q ≈ 0.4 shows that domain 1 and the contacts between β-strand s5A and RCL (black ellipse) are formed. In addition, several contacts between the N and C termini which are also interdomain contacts are also partially formed. (C) The average 2DFES plotted as a function of Qdomain2 and Qdomain1 shows that domain 1 folds before domain 2 during folding. The colors show the height of the free energy in kBTf with the same scale as that shown in Fig. 5A. The errors on the 2DFES are shown in SI Appendix, Fig. S4.

