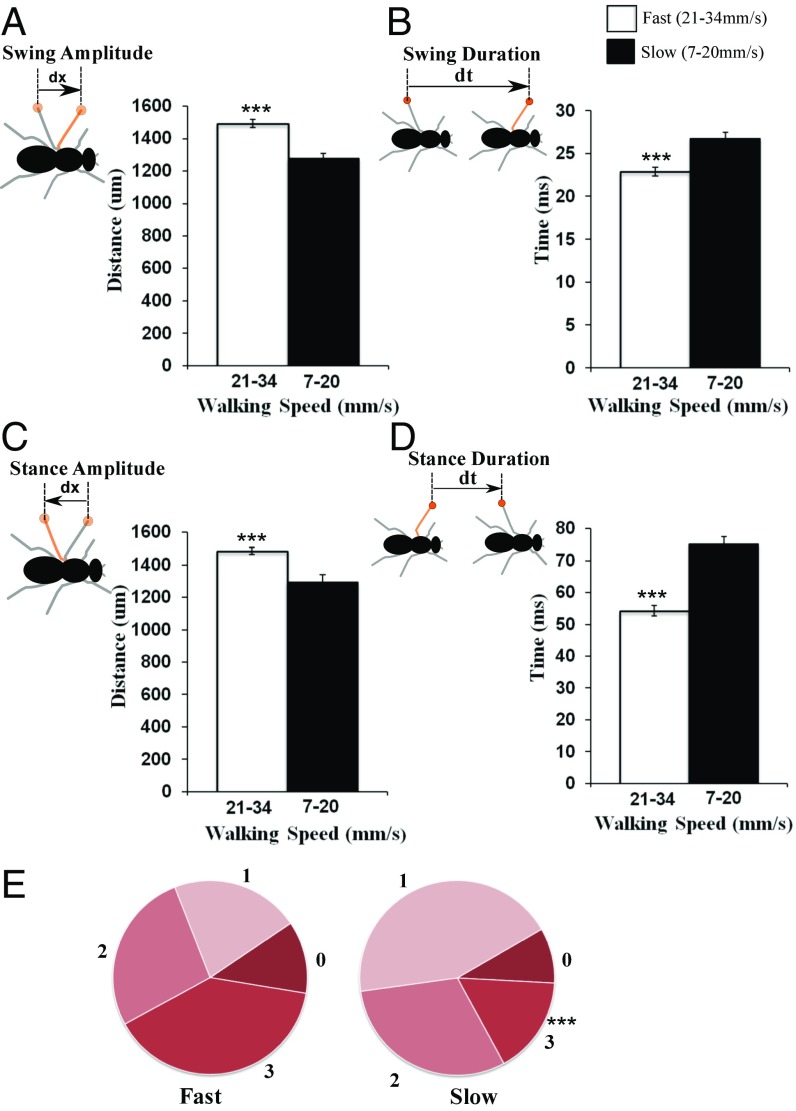
Fig. 3.
Relationship between walking speed and leg phase characteristics in freely walking flies. Leg movement parameters are quantified and classified into two speed intervals: slow (7.0–20.0 mm/s) and fast (21.0–34.0 mm/s). (A) Swing amplitude is the average displacement of the leg tip during the swing phase as calculated in the fly’s inertial reference frame; it increases as the walking speed increases. (B) Swing duration is the time of the swing phase; it decreases as the walking speed increases. (C) Stance amplitude is the average displacement of the leg tip during the stance phase as calculated in the fly’s inertial reference frame; it increases as the walking speed increases. (D) Stance duration is the time of the stance phase; it decreases as the walking speed increases. (E) Concurrency state proportions change with respect to walking speed. State 3 is proportionately higher at faster walking speeds but lower at slower walking speeds. n = 39 videos. Quantitative analysis for the entire bar plots was performed using Student’s t test. The entire bar plots represent mean ± SEM (***P ≤ 0.001). Quantitative analysis for the pie chart was performed using two-way repeated measures (RM)-ANOVA and showed significant difference in the concurrency state 3 slower walking flies compared with fast walking flies, F(3, 111) = 42.17, P < 0.001. Post hoc testing using Sidak multicomparison test showed a significant difference in concurrency state 3 of slow walking flies in comparison with fast walking flies (***P < 0.001).

