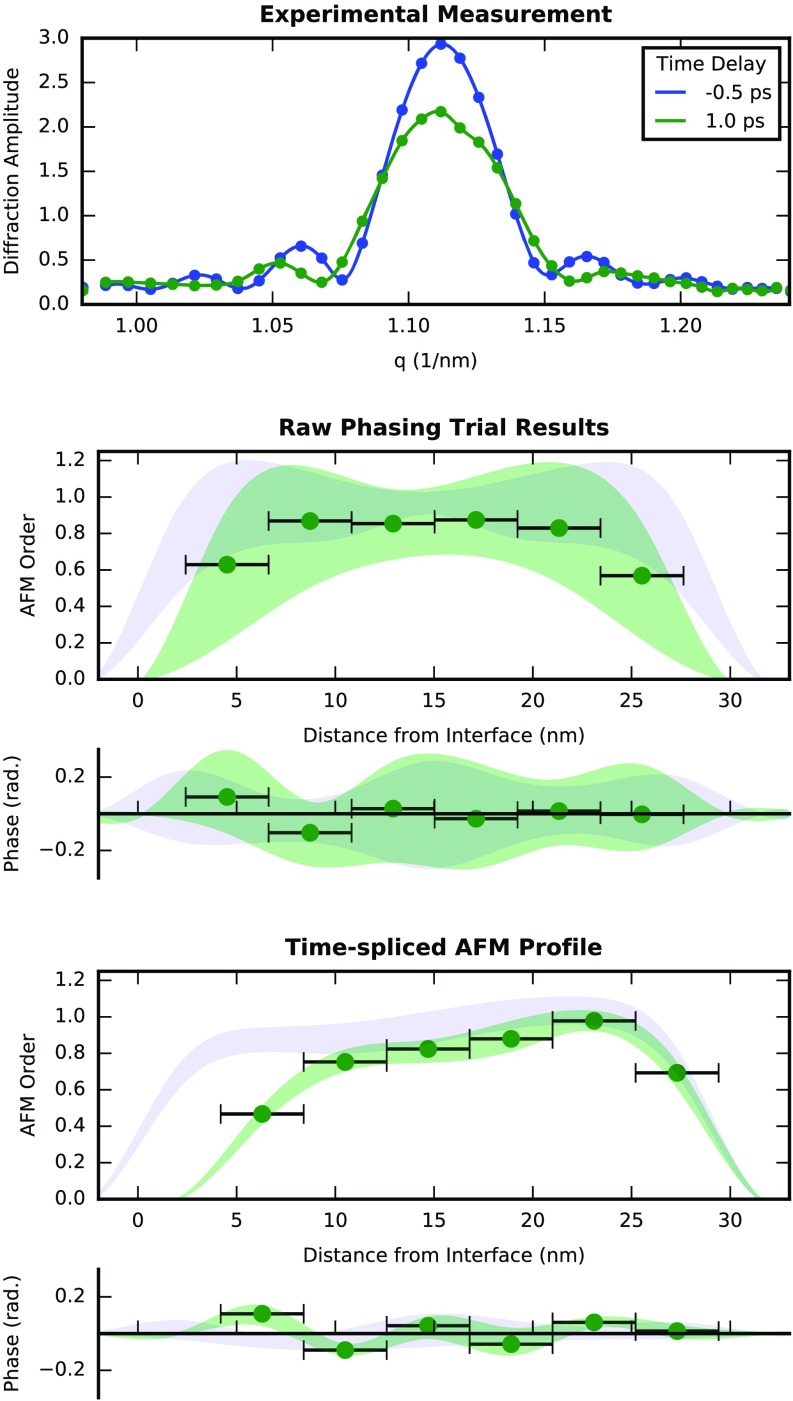
Fig. 2.
Workflow of the magnetization depth profile reconstruction algorithm. (Upper) X-ray rocking curves measured with −0.5- and +1.0-ps mid-IR excitation time delays. For all time delays, 50 independent phasing trials were performed starting from diffraction peaks like those shown. (Center) The average raw recovered AFM order and phase, profiles, m(z) and ϕ(z), are shown for the −0.5-ps (blue) and +1.0-ps (green) time delays. Here, discrete values of the +1.0-ps average profiles are shown, with the horizontal error bars depicting the inverse q-range spatial resolution of the profile and the shaded areas depicting the SD of the solution set. The raw set of solutions were then aligned and averaged before time splicing. (Lower) The final AFM order and phase profiles obtained after the average profiles were spliced together.

