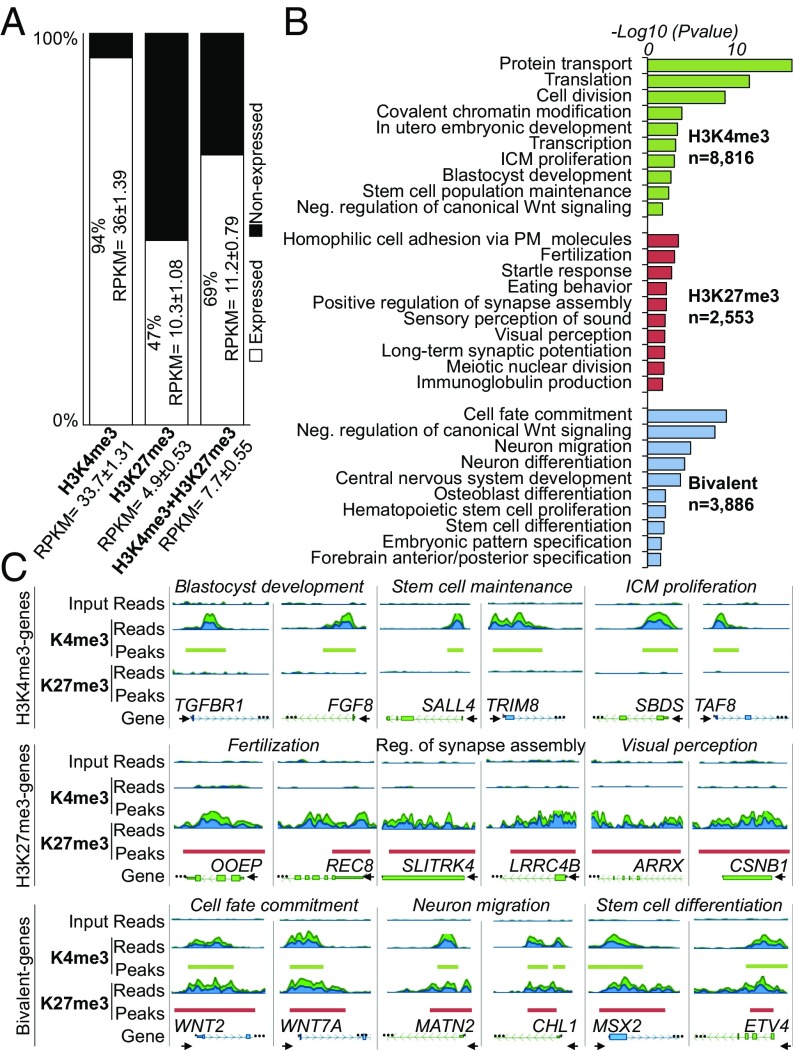
Fig. 2.
Histone methylation landscape of CTFR-bESCs. (A) Transcriptional status of genes containing H3K4me3, H3K27me3, or bivalent domains. Genes with RPKM ≥0.4 were considered expressed, and genes with RPKM <0.4 were considered nonexpressed. Mean RPKM ± SEM values of expressed genes are shown inside the bar plot, and mean RPKM ± SEM values for all genes (expressed and nonexpressed) are shown on the x axis. (B) Functional characterization of genes containing H3K4me3 (n = 8,816), H3K27me3 (n = 2,553), or bivalent domains (n = 3,886). The top-10 GO terms are shown. The bar plot shows the −log10 of the P value for selected GO term biological processes from DAVID. (C) Genome browser snapshot of genes containing H3K4me3 (TGFBR1, FGF8, SALL4, TRIM8, SBDS, and TAF8), H3K27me3 (OOEP, REC8, SLITRK4, LRRC4B, ARRX, and CSNB1), or bivalent domains (WNT2, WNT7A, MATN2, CHL1, MSX2, and ETV4). H3K4me3-, H3K27me3-, and bivalent-selected genes were associated with three different GO terms. The start of the gene is denoted by a black arrow.

