Fig. 4.
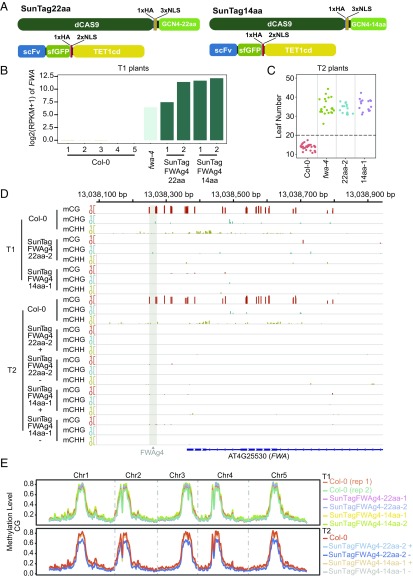
Targeted demethylation at the FWA promoter using SunTag-TET1cd. (A) Schematic representation of the SunTag-22aa (Left) and SunTag-14aa (Right) systems. (B) Bar graph showing FWA expression in five Col-0, one fwa-4, and two T1 plants each for SunTagFWAg4-22aa and SunTagFWAg4-14aa. (C) Flowering time of Col-0, fwa-4, and one representative SunTagFWAg4-22aa and SunTagFWAg4-14aa T2 line. (D) Screenshot of CG, CHG, and CHH methylation levels over the FWA promoter in Col-0, one representative SunTagFWAg4-22aa and SunTagFWAg4-14aa T1 line, and one representative T2 plant of the same lines containing the transgene (+) or that had segregated it away (−). A gray vertical line indicates the FWAgRNA-4 binding site (FWAg4) in the FWA promoter. 5′ proximal representation of the FWA transcribed region is depicted in blue with filled squares indicating the UTRs and diamond lines indicating introns. (E) Genome-wide CG methylation levels in two Col-0 plants, two T1 lines each for SunTagFWAg4-22aa and SunTagFWAg4-14aa (Upper), as well as one Col-0, one T2 plant containing the transgene (+) or one that had segregated it away (−) for representative SunTagFWAg4-22aa and SunTagFWAg4-14aa lines (Lower). Methylation level is depicted on the y axis.

