Fig. 5.
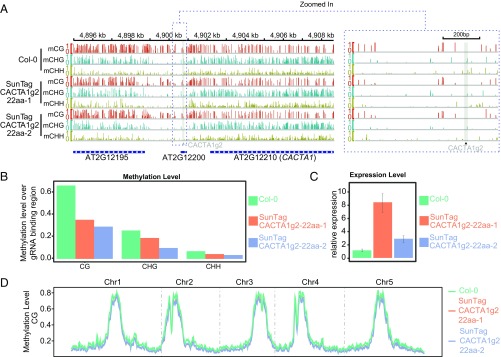
Targeted demethylation of CACTA1 using SunTag–TET1cd. (A) Screenshot of CG, CHG, and CHH methylation levels over the CACTA1 region in Col-0 and two representative SunTagCACTA1g2-22aa T1 lines. A gray vertical line indicates the gRNA binding site in the promoter region of CACTA1. A zoom in of the targeted region is shown (Right). (B) Bar graphs depicting the methylation levels in the region comprising 200 bp upstream and downstream of the gRNA binding sites for Col-0 and two representative SunTagCACTA1g2-22aa T1 plants. (C) Bar graph showing relative expression by qRT-PCR of CACTA1 over IPP2 in Col-0 and two representative SunTagCACTA1g2-22aa T1 plants. Mean values ± SD (n = 2, technical replicates). (D) Genome-wide CG methylation levels in Col-0 and two representative SunTagCACTA1g2-22aa T1 plants. Methylation level is depicted on the y axis.

