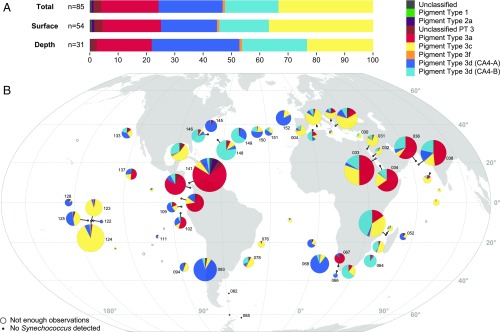
Fig. 2.
Distribution of Synechococcus pigment types (PTs). (A) Relative abundance of each PT in the whole dataset (Total), in surface, and at the deep chlorophyll maximum (DCM). (B) Map showing the global distribution of all Synechococcus PTs in surface waters along the Tara Oceans transect. Diameters of pies are proportional to the number of cpcBA reads normalized by the sequencing effort. Stations with less than 30 cpcBA or mpeBA reads are indicated by open circles, and those with no cpcBA reads by black dots. Numbers next to pies correspond to Tara Oceans stations.

