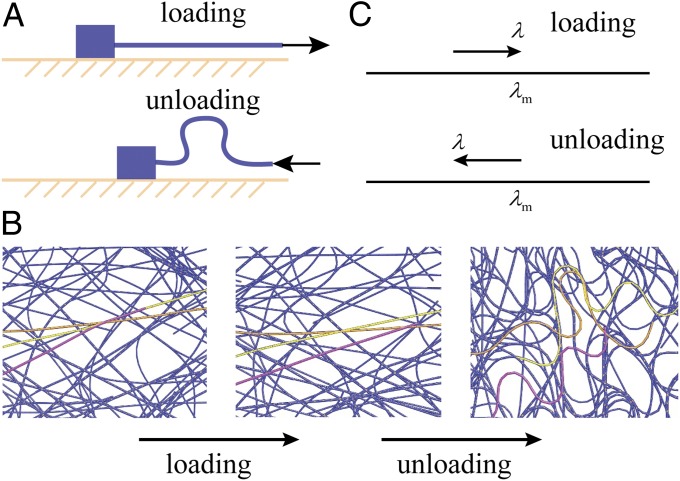
Fig. 4.
Schematic and results of the CNTs morphology during loading and unloading. (A) Schematic of the asymmetric behavior of the CNTs between reorientation and sliding during loading and buckling during unloading. This leads to the hysteretic microstructural parameter and therefore, resistance of CNTs between loading and unloading. (B) CGMS simulation results showing CNTs reorienting and sliding during loading and buckling during unloading in the same region. (C) In the analytic model of the evolution of (Eqs. 1 and 2), during loading and subsequent loading beyond the maximal stretch reached before, the maximal stretch equals , while during unloading, is the maximal stretch ever reached and .

