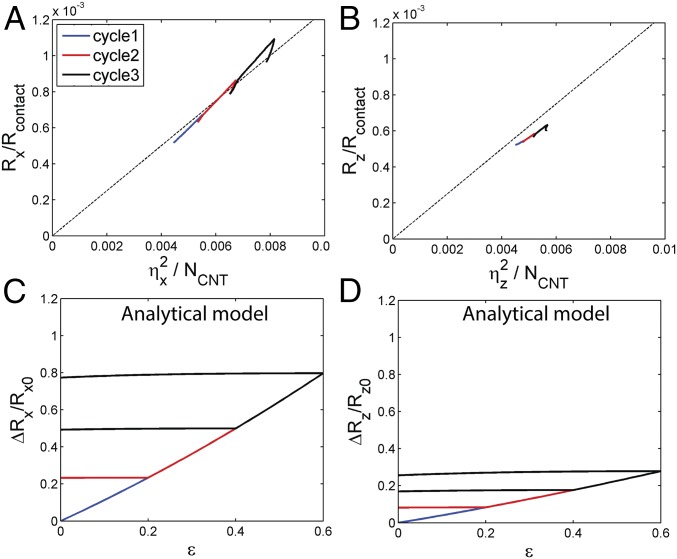
Fig. 5.
Resistance evolution based on the analytic model. (A and B) Linear correlations between and in both x and z directions are shown based on the CGMS simulation results. The simulation results are for CNTs with length and diameter , each discretized by nodes, in a simulation cell with . The dashed lines are fitting curves . (C and D) Analytic results of the evolution of the relative change of resistances and under three sequentially increasing strain cycles of 20, 40, and 60% based on Eqs. 1–4. The analytic results are for CNTs corresponding to the CGMS simulation in Fig. 2 C and D.

