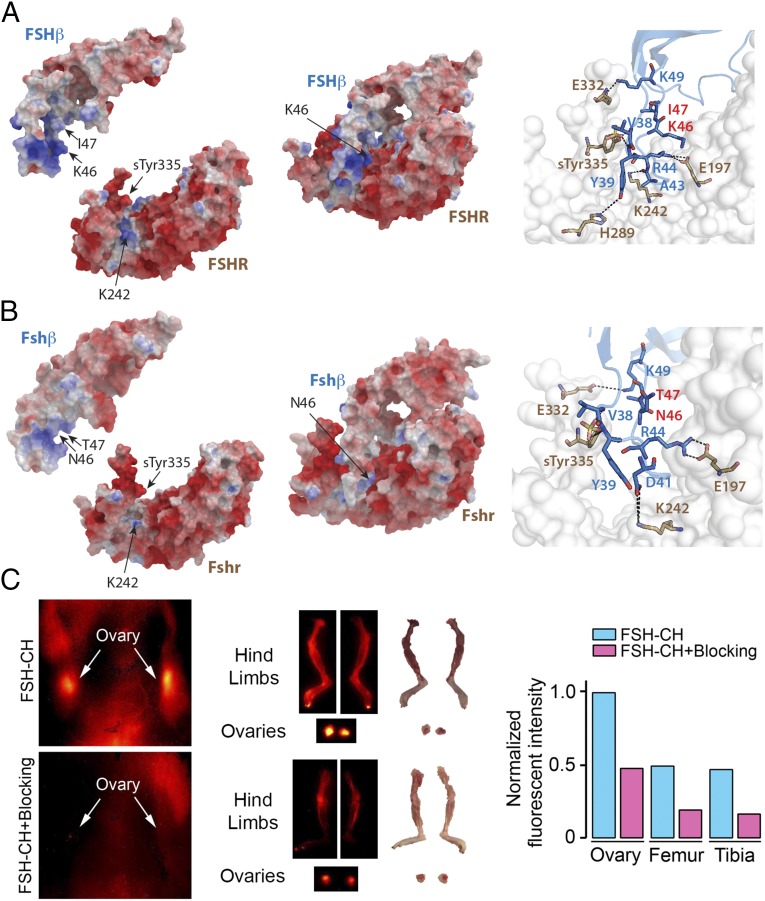
Fig. 1.
Interaction between the binding domain of human and mouse FSHβ and the FSHR. (A) The crystal structure of FSHβ in complex with the entire ectodomain of FSHR (FSHα omitted for clarity) was used as the template (PDB ID code 4AY9) for comparative modeling. (Right) Dashed lines show interactions between specific amino acids of the human FSH–FSHR complex (discussed in Results). Of note is that K46 and I47 are noninteracting residues. (B) High sequence identity between mouse FSHR (UniProt ID code Q9QWV8) and human FSHR (88%) permitted accurate homology modeling (Modeler, PROCHECK, and PROSA). The FSHβ binding epitope differs by only two amino acids (LVYKDPARPKIQK → LVYKDPARPNTQK). Several models of the mouse Fshβ epitope were constructed (ICM software) (38); restrained minimization was used to remove steric clashes, and the final model was selected on basis of the lowest Cα rmsd after superimposition on template structure (0.2 Å). Fshβ binds in the groove generated between the palm and the thumb of the Fshr. The electrostatic surfaces generate a complementary surface charge (red: acidic residues; blue: basic residues) between the Fshr and Fshβ. Since the crystal structure provides a static snapshot, a short burst of MD simulation was run to allow the side chains of Fshr and Fshβ to dynamically equilibrate and adapt to the contours of the complex (Methods). (Right) Dashed lines show interactions between specific amino acids of the FSH–FSHR complex. N46 and T47 are noninteracting residues. (C) NIR-II imaging of Fshr-expressing ovaries and bones using FSH-CH in adult female mice. FSH-CH (12.5 µg) was injected into the tail vein of mice before in vivo imaging 2 h later. (Left) Supine view showing fluorescent signals in ovaries (Top), which were blocked with 30-fold excess of unconjugated FSH (Bottom); this indicated hormonal specificity of signals. (Middle) NIR-II fluorescence was detected in dissected ovaries and hind limbs (Top); 30-fold excess of unconjugated FSH blocked these signals (Bottom). (Right) Normalized fluorescence intensity for each tissue is shown.

