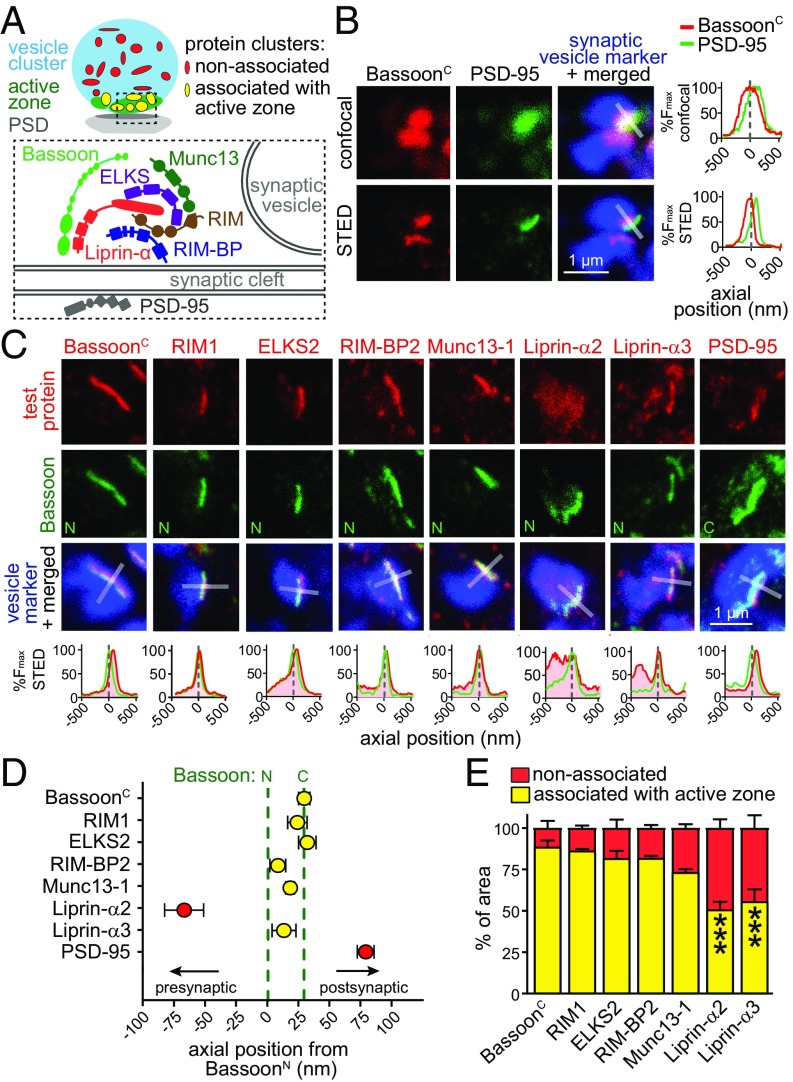
Fig. 1.
STED microscopy establishes active-zone localization of Liprin-α3 at excitatory hippocampal synapses. (A) Schematic illustration of a synapse. (B) Example images of hippocampal excitatory synapses in side view in confocal and STED microscopy stained for BassoonC and PSD-95. The synaptic vesicle cluster (labeled for synapsin) was imaged by confocal microscopy in all experiments. The intensity profile normalized to peak fluorescence is shown for the profile scan (transparent white rectangle) perpendicular through the center of Bassoon. (C) Representative STED images of individual excitatory synapses in side view stained for test proteins, Bassoon, and the vesicle marker vGlut1 (for PSD-95, synapsin antibodies were used due to limitations in antibody compatibility). Fluorescence intensity profiles are shown below. Dashed line at zero indicates the peak localization of BassoonN. Overview images and confocal scans are provided in Fig. S1. (D) Axial positions of test proteins relative to BassoonN. BassoonN, n = 920 synapses/8 independent cultures; BassoonC, n = 231/3; RIM1, n = 130/3; ELKS2, n = 141/3; RIM-BP2, n = 84/3; Munc13-1, n = 92/3; Liprin-α2, n = 105/3; Liprin-α3, n = 234/3; PSD-95, n = 79/3. (E) Percentage of test protein clusters associated (yellow) or not associated (red) with the active zone. BassoonC, n = 985 synapses/5 images/3 independent cultures; RIM1, n = 795/5/3; ELKS2, n = 845/6/3; RIM-BP2, n = 1,298/6/3; Munc13-1, n = 1,935/6/3; Liprin-α2, n = 1,296/6/3; Liprin-α3, n = 1,425/6/3. Statistical significance determined by two-way ANOVA (localization significant at P ≤ 0.001; test protein not significant, interaction significant at P ≤ 0.001) followed by Holm–Šídák posttests (reported in figure) comparing each distribution vs. that of BassoonC. All data are means ± SEM (***P ≤ 0.001).

