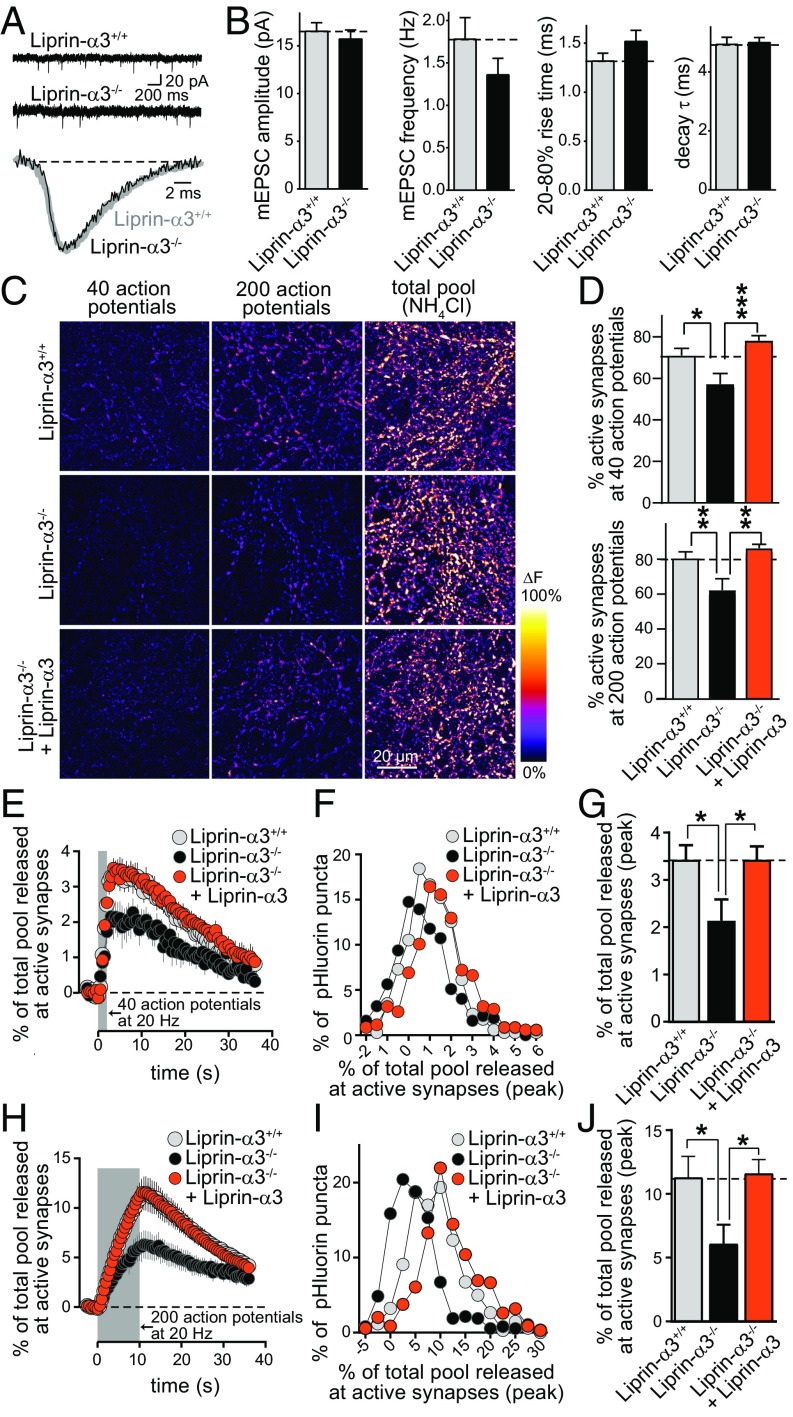
Fig. 3.
Synaptic vesicle exocytosis is impaired upon Liprin-α3 KO. (A and B) Example traces (A) and quantification (B) of mEPSCs. Liprin-α3+/+, n = 47 cells/4 independent cultures; Liprin-α3−/−, n = 48/4. (C) Pseudocolored images of peak fluorescence change in sypHy-expressing Liprin-α3+/+ neurons, Liprin-α3−/− neurons, and Liprin-α3−/− neurons rescued with lentiviral expression of Liprin-α3 transduced at DIV 1. Neurons were stimulated with 40 or 200 action potentials and dequenched with NH4Cl. (D) Quantification of the percentage of sypHy puncta responsive to 40 (Top) or 200 (Bottom) action potentials. (E–G) Quantification of sypHy mean fluorescence changes at active synapses stimulated with 40 action potentials expressed as percentage of the NH4Cl-responsive vesicle pool (E), and the frequency distribution (F) and peak response (G) of the same data. Liprin-α3+/+, n = 2,365 NH4Cl-responsive synapses/1,338 active synapses/11 coverslips/6 independent cultures; Liprin-α3−/− 2,371/1,093/11/6; Liprin-α3−/− + Liprin-α3, n = 2,438/1,463/11/6. (H–J) Quantification as in E–G but for neurons stimulated with 200 action potentials. Liprin-α3+/+, n = 2,353/1,485/11/6; Liprin-α3−/−, n = 2,346/1,164/11/6; Liprin-α3−/− + Liprin-α3, n = 2,427/1,598/11/6. All data are means ± SEM [*P ≤ 0.05, **P ≤ 0.01, and ***P ≤ 0.001, Student’s t tests (B; all P > 0.05) or one-way ANOVA (D, G, and J) followed by Holm–Šídák multiple comparisons test comparing each condition vs. Liprin-α3−/−]. The number of coverslips was used as a basis for statistics in sypHy imaging.

